
Back to Blog ai
ai
 gemma
gemma community
 ai
ai ai
ai githubactions
 ai
ai
Building an Autonomous SRE Agent with Google ADK and the Antigravity SDK
Yurii Serhiichuk July 9, 2026
0 views
One of the most stressful parts of being an on-call engineer is triaging a production incident in the...
One of the most stressful parts of being an on-call engineer is triaging a production incident in the middle of the night. Modern distributed systems amplify the pain with extra cognitive overload of, well, the distributed systems: logs scattered across dozens of microservices, traces potentially stored in multiple different locations and a dozen of observability tools and dashboards on hand. While this (usually) makes total sense for SREs to design and develop this the way it is (maybe because of the costs or being knowledgeable in this or that tool, or just optimizing for a particular concern), this adds a lot of load for any on-call engineer.
So in era of AI, it makes total sense to get some aid from the autonomous and smart systems that are fine-tuned for your setup, that remember all the bits and pieces that are suitable for your infrastructure.
In this post I'm trying to go over a blueprint of such an autonomous SRE system - an AI agent that can be hosted near your main system and fine tuned to work with a set of tools you use.
I will be using Google Agent Development KIT (ADK) for multi-agent diagnostic reasoning and Google Antigravity SDK for the agent runtime - tool wiring, easy-to-apply safety policies and agentic orchestration. The setup will be deployed as a set of Google Cloud Run services but while being containerized can be easily ported to any other containerized platform. The entire stack runs locally as well with zero GCP credentials in a mock-telemetry mode, so you can try it in under a minute.
The Core Architecture: Reasoning + Safety
A proper SRE assistant has to get two things right at once: reasoning orchestration (which diagnostic step happens when) and environmental safety (the agent must never be able to mutate production while it pokes around). The blueprint splits these concerns across four small Fast API services that talk to each other over Agent-To-Agent protocol with results being streamed back as Server-Sent Events (SSE).
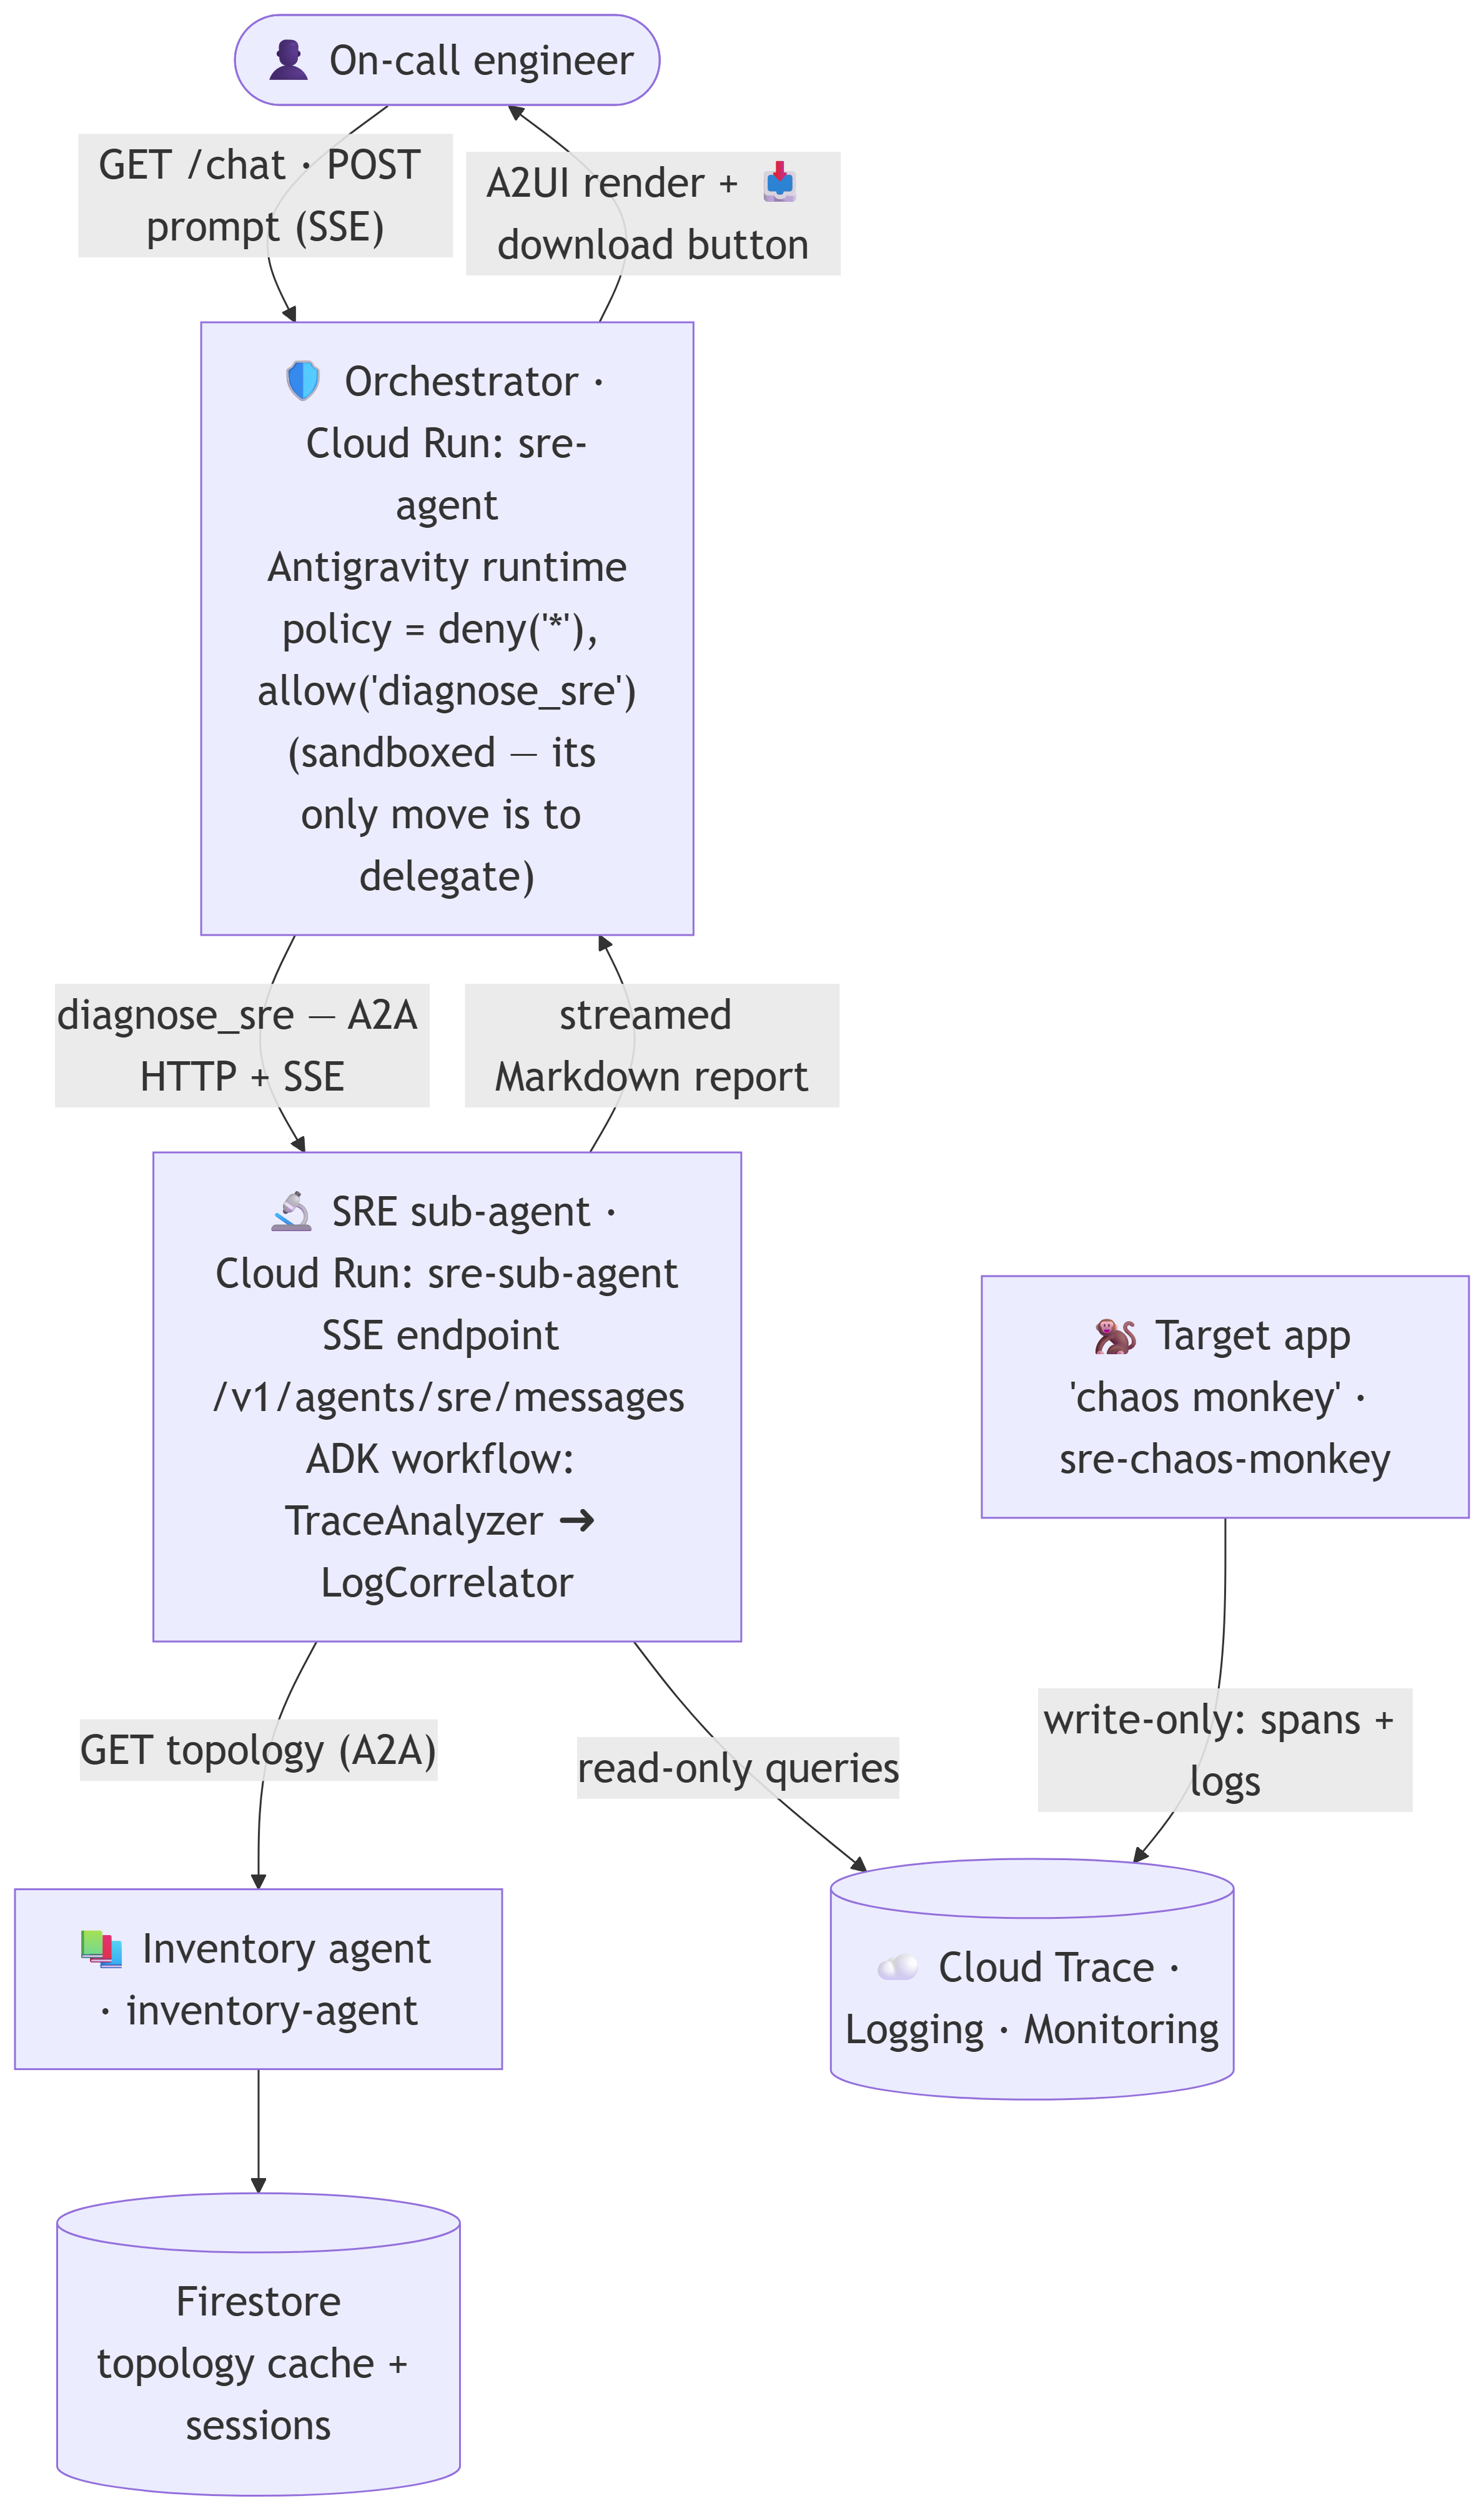
I'm using Google Antigravity SDK as an orchestrator and front-facing agent while it provides superior safety gates out of the box and is smart-enough to handle user requests.
safety_policies = [
    deny("*"),  # nothing is allowed by default
    allow("diagnose_sre")  # …except delegating to the SRE sub-agent
]
The config above basically gates whatever tools we want to allow for the agent to use.
And Google ADK agents fulfill the diagnostic workflows. ADK v2 which I am using is graph-based and the SRE sub-agent runs two-node graph:
- TraceAnalyzer - scans recent trace summaries, filters for transactions that errrored or breached the latency budget (>5000ms), and isolates the single failing
traceId. - LogCorrelator pulls the spans and the logs tagged with that
traceId, then reasons over them with metric queries, cascade analysis, and post-mortem generation tools to produce the root-case report.
The third agent is an inventory agent that aids the SRE with aggregated knowledge of resources available in the GCP project. This helps grounding diagnostics and makes sure the agent works against particular resources instead of trying to look around too much.
Anatomy of a Diagnosis
When an alert fires, here's what actually is going to happen end to end from the on-call prompt to a finished post-mortem.
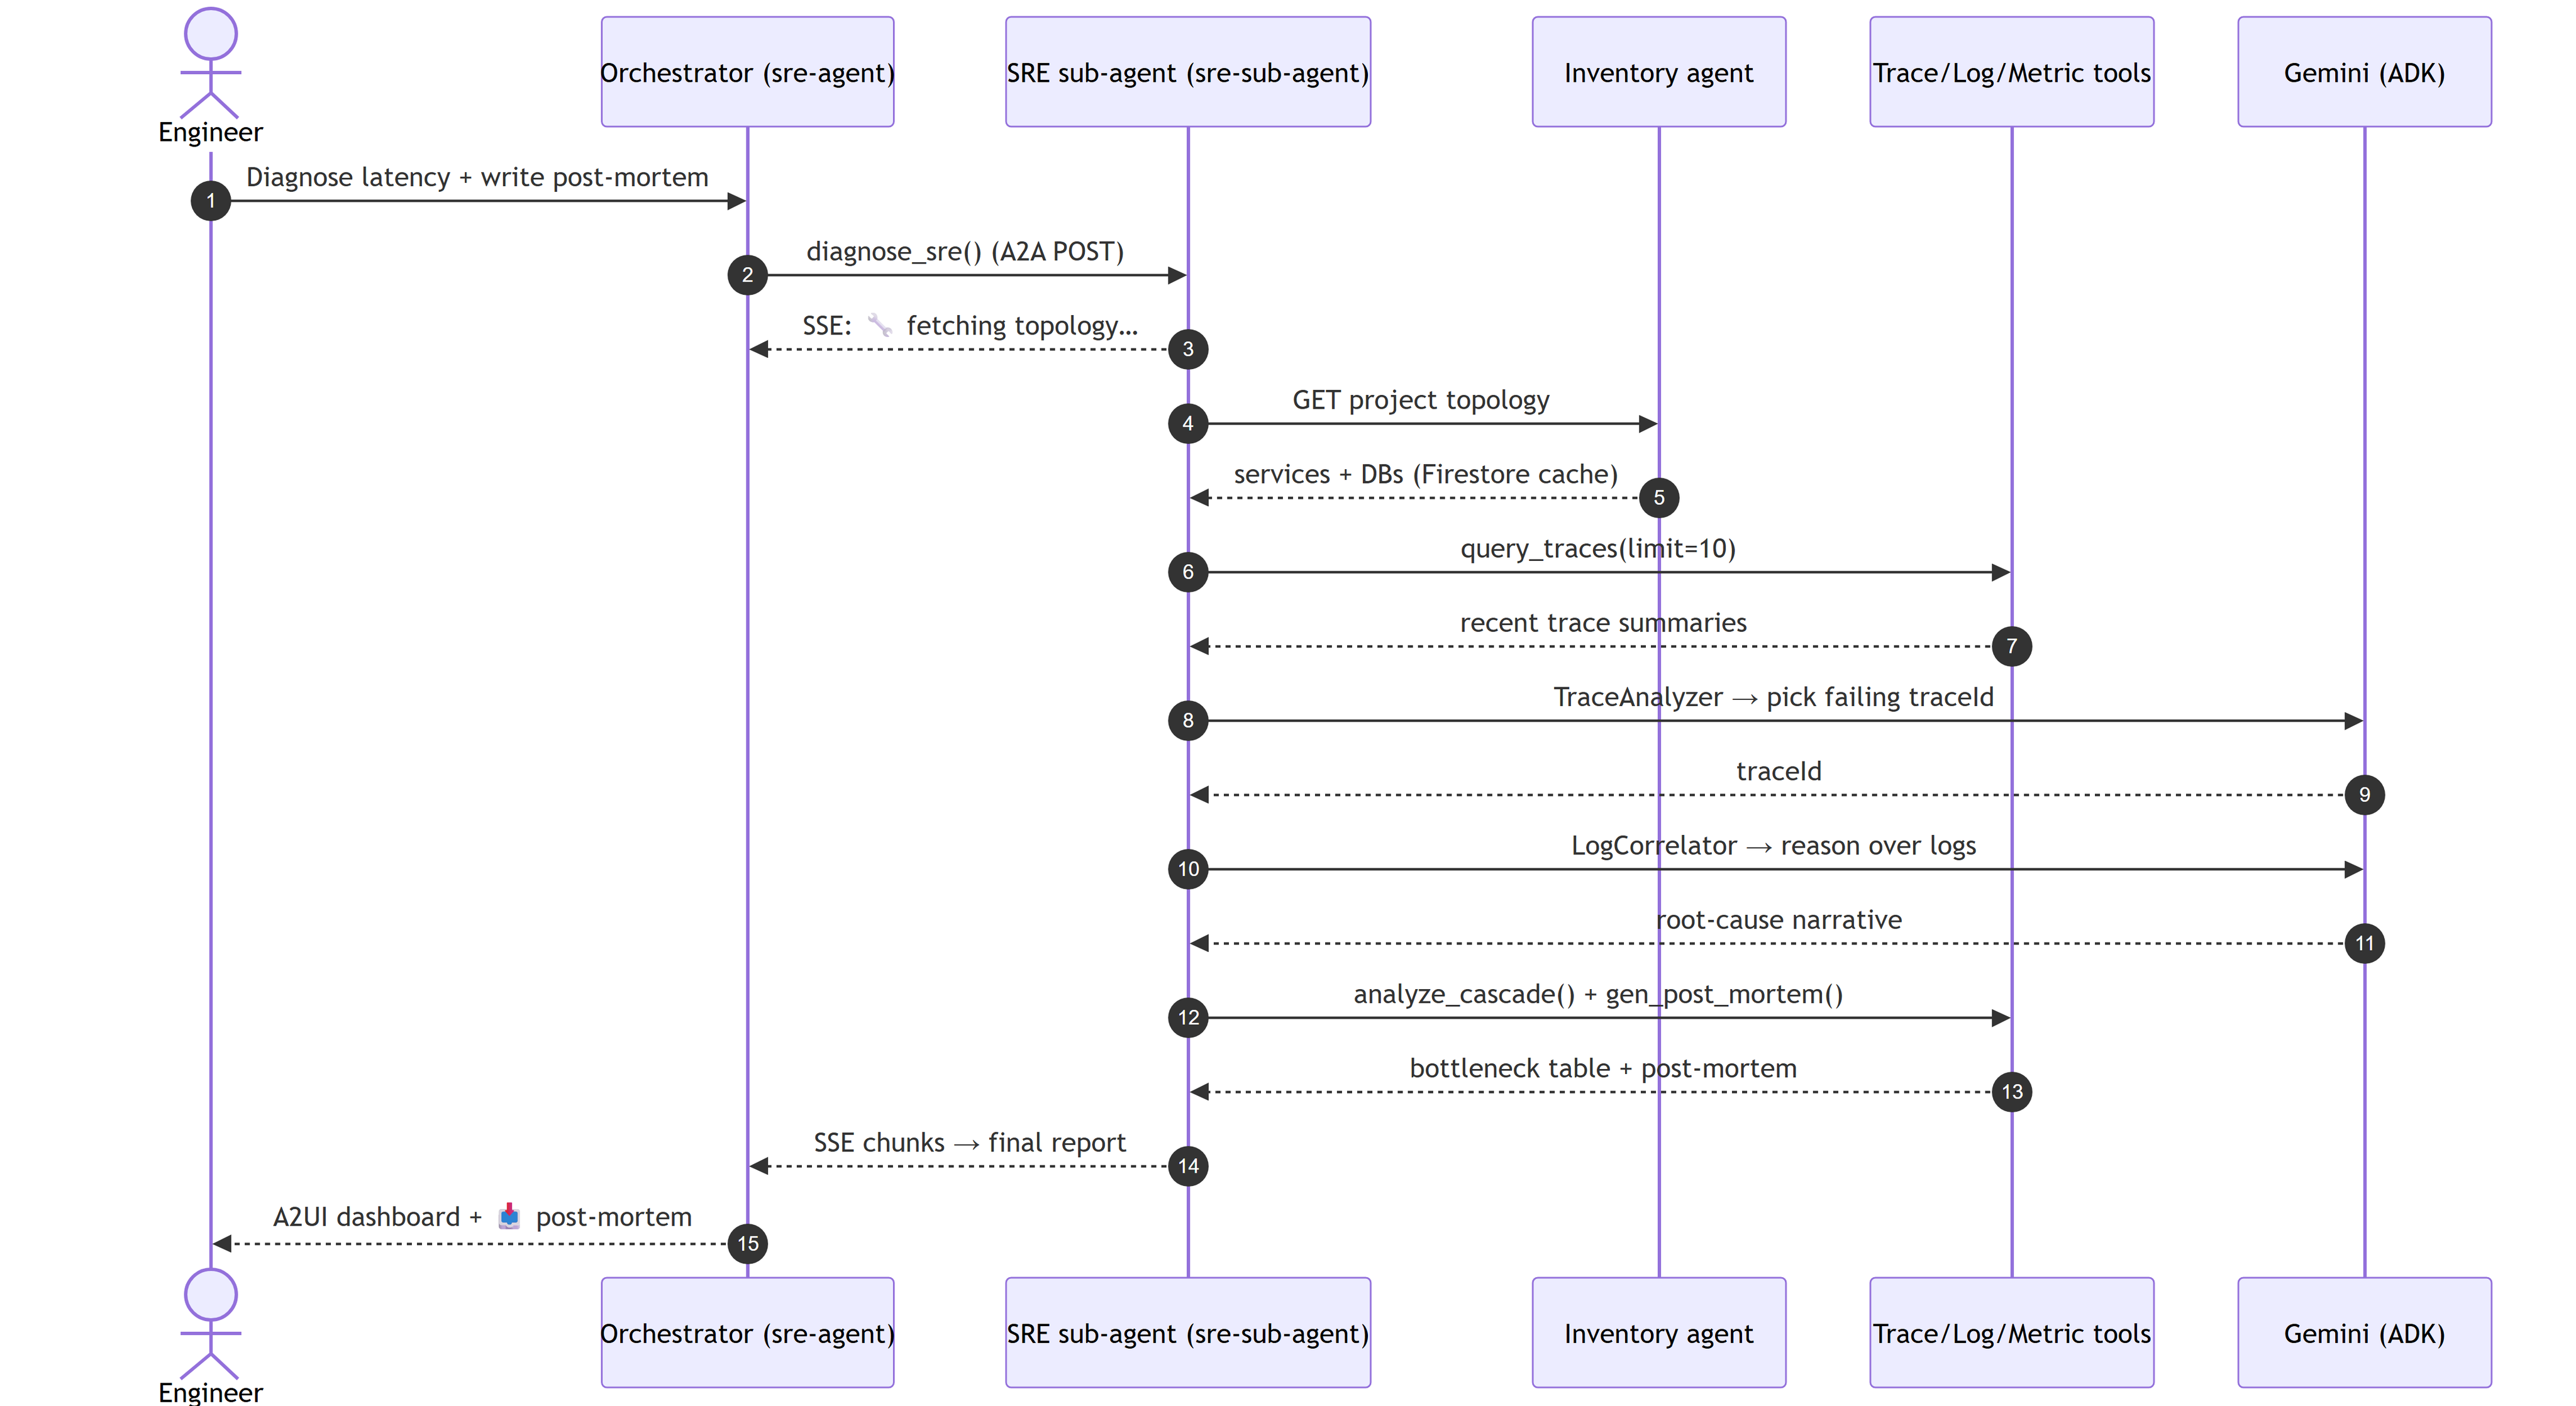
The Orchestrator does the one thing its policy allows: it hands the problem to the SRE sub-agent and steps back. From there the sub-agent streams its progress back as Server-Sent Events, so the on-call engineer watches the investigation unfold live instead of waiting on a spinner.
It starts by pulling the project topology — which services exist, how they call each other, and where their databases sit — from the Inventory agent's Firestore-backed cache; that map tells the diagnosis where to look. It then fetches the recent traces and runs them through the two-node graph: TraceAnalyzer collapses thousands of spans down to the single failing trace worth investigating, and LogCorrelator pulls every span and log line sharing that trace's ID to name the actual root cause — not just "the database was slow," but which span failed, with which error, and why.
Only then does it run the cascade analysis and draft the post-mortem, streaming the finished report back through the Orchestrator to the chat UI, where it lands as a rendered dashboard with a one-click download.
The beauty of such approach is extensibility of the setup. You can add new sub-agents or expand existing tools easily with ADK and A2A protocol.
Deep Dive: Cascade Latency & Bottleneck Analysis
In order to showcase the agent, I have also built another Fast API service that emulates real database errors with timeout exceptions and telemetry spans. As it is just a simulation, quite a lot of actual problems are quite similar to this one and frequently the initial gateways/backends latency or errors are hidden downstream. But of course this is a textbook example still: a gateway request that looks 10-second-slow, but where 99% of the time is actually trapped in a database call three levels down.
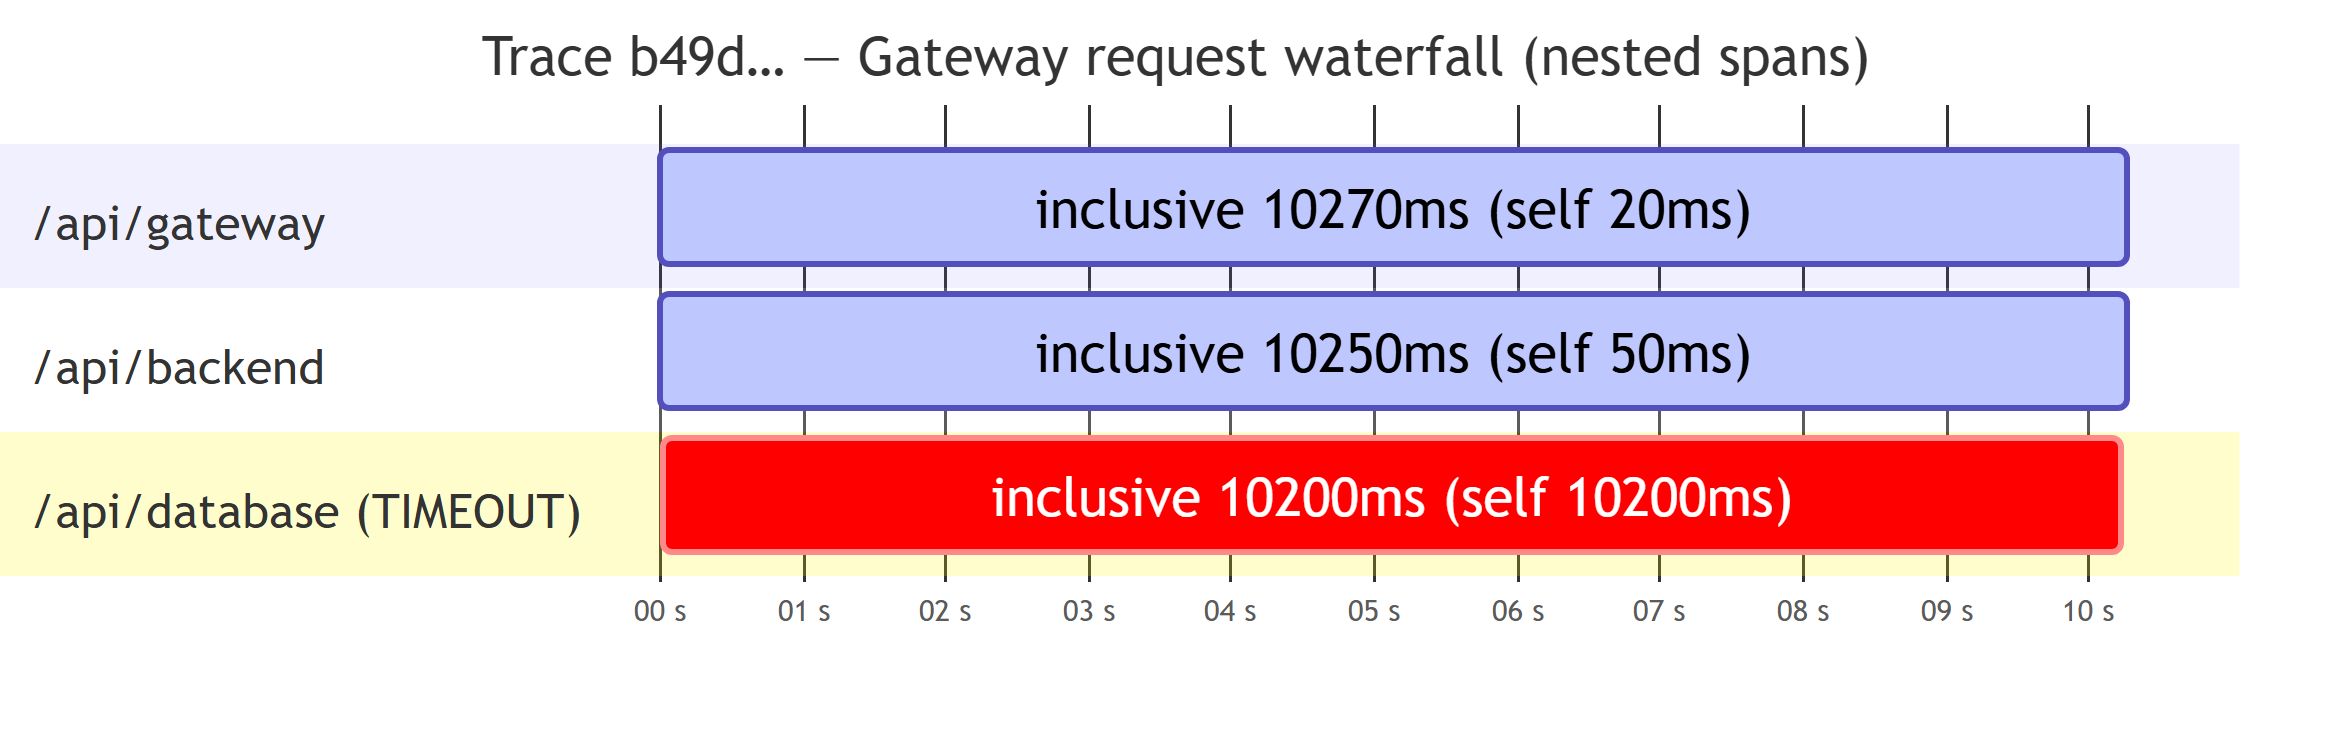 All three spans look ~10 s slow (inclusive), but the red /api/database bar is where the time is actually spent.
The cascade-analysis tool builds the span parent/child map and computes, for every span:
- Inclusive duration — wall-clock time of the span including its children.
- Exclusive (self) duration — the active time spent in that span alone:
ExclusiveTime(s) = InclusiveTime(s) - sum of InclusiveTime(children)
The span with the largest exclusive time is the true bottleneck. Here is the actual, verified output from incident simulator (available in the repo):
### 🔍 Span Latency Breakdown
Service / Span Name     Span ID             Parent ID           Status   Inclusive Time   Exclusive (Self) Time   Contribution
────────────────────────────────────────────────────────────────────────────────────────────────────────────────────────────────
/api/gateway            span-gateway-111    None                ERROR    10270 ms         20 ms                   0.2%
  └── /api/backend      span-backend-222    span-gateway-111    ERROR    10250 ms         50 ms                   0.5%
      └── /api/database span-database-333   span-backend-222    ERROR    10200 ms         10200 ms                99.3%

### 🚨 Identified Bottleneck
*   Bottleneck Span:     /api/database (span-database-333)
*   Self-Execution Time: 10200 ms (99.3% of total trace)
*   Status:              ERROR
*   Error Message:       ConnectionTimeoutError: Failed to connect to db-primary.gcp.internal:5432 after 10000ms
The gateway and backend each look "slow" at 10 s inclusive, but their self time is a rounding error. The agent ignores the noise and points straight at /api/database — 99.3% of the budget, burned in a single connection timeout.
Automated Post-Mortem & One-Click Export
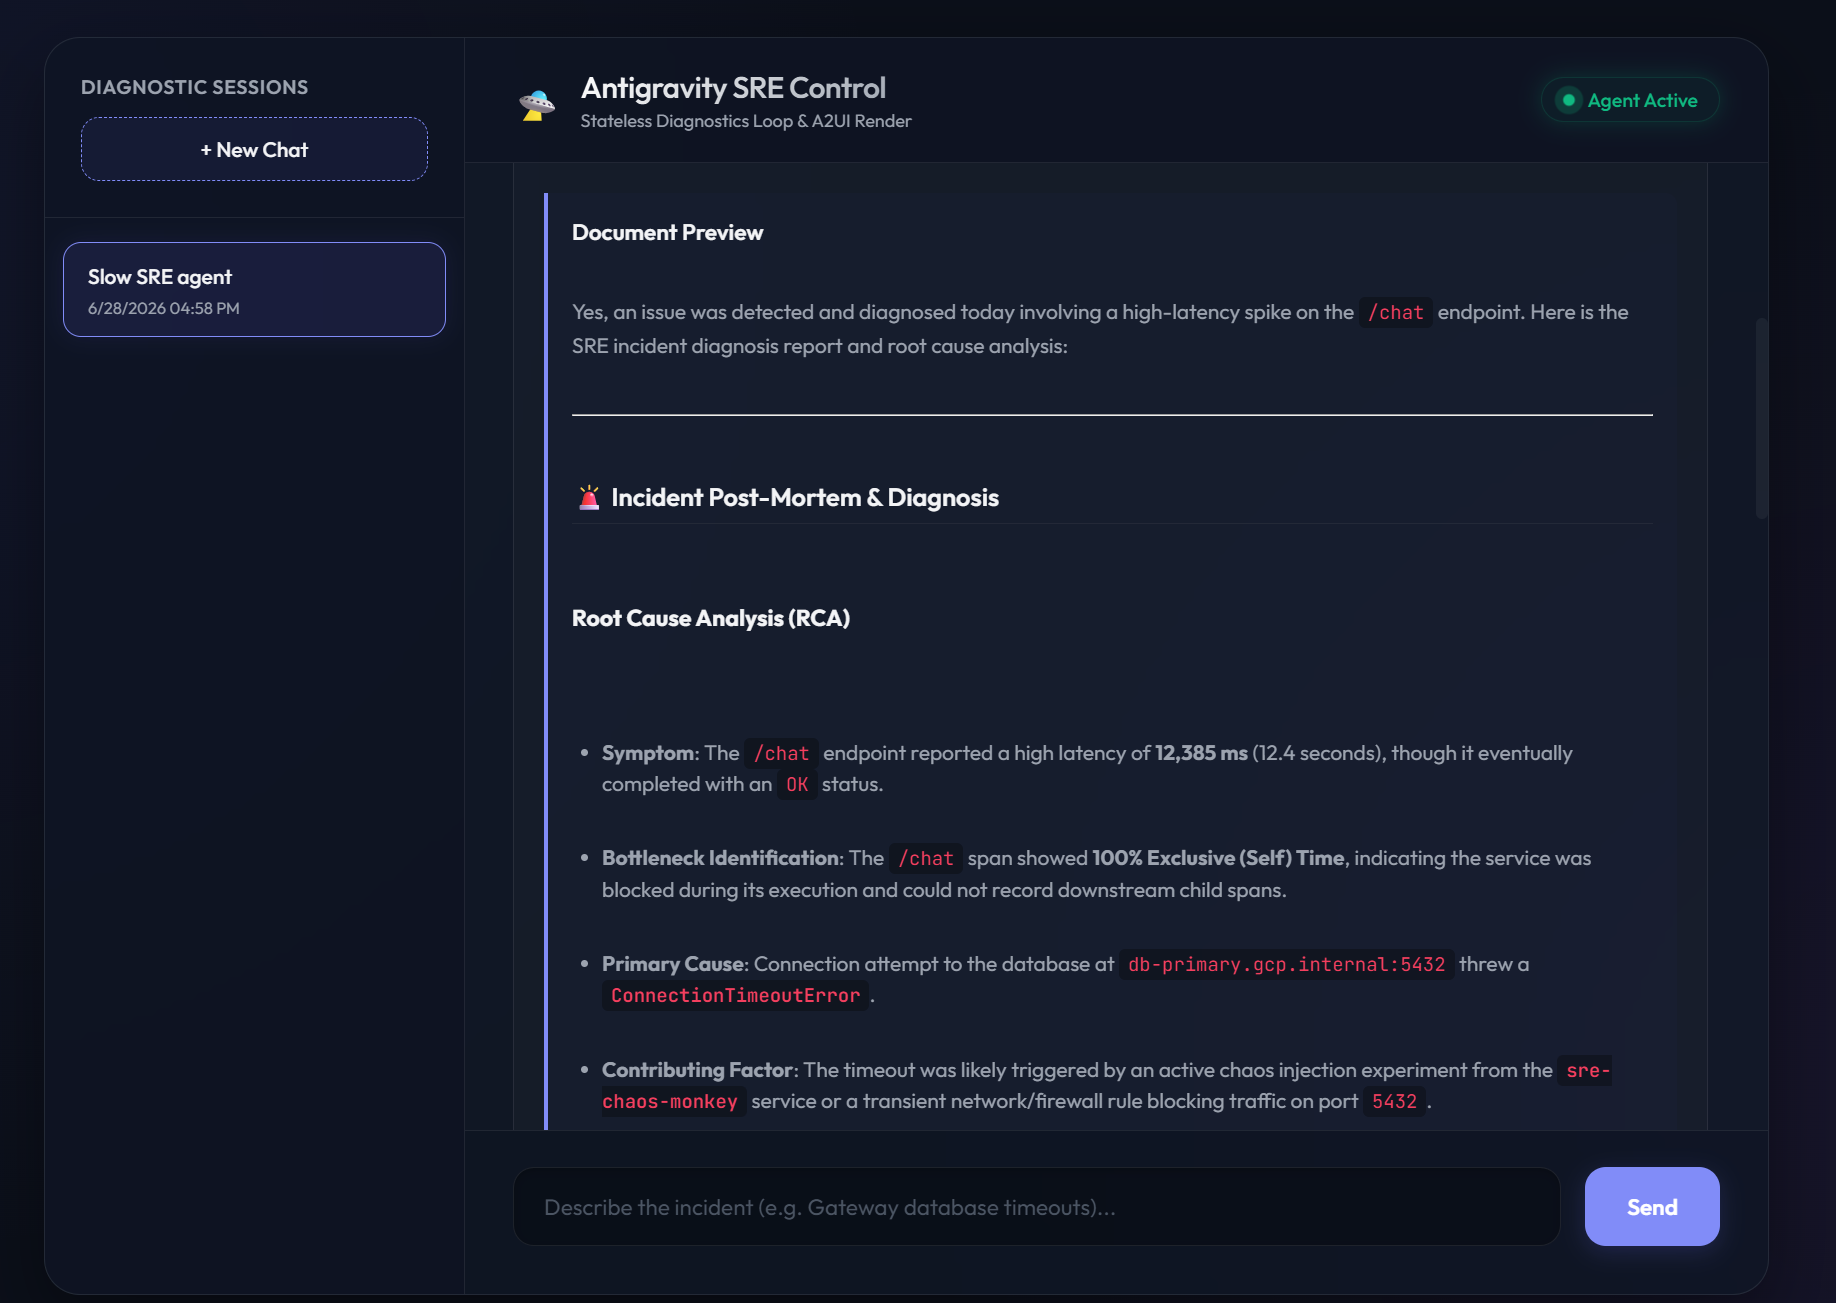
Diagnosis is only half the job; the deliverable on-call engineers actually need is a post-mortem. After the cascade analysis, a post-mortem generator drafts a complete Markdown document with an Incident Overview (time, root service, Trace ID, impact duration), a Timeline, a Root Cause Analysis, and a Prevention Plan — all populated from the real trace and log data.
That Markdown is then rendered via A2UI protocol
 From SRE report markdown to a one-click, client-side post-mortem download.
A server-side translator spots the post-mortem heading and appends a download-button component; the browser renders it as a styled button that builds the file entirely in the browser — no server round-trip — from the Markdown it already holds.
One click exports post_mortem.md, ready to drop into your incident-review wiki.
And here is how this actually looks like in the deployed UI.
Least-Privilege IAM on Cloud Run
Handing an autonomous agent unrestricted cloud access is a non-starter. The deploy pipeline gives each Cloud Run service its own service account with the narrowest possible role set:
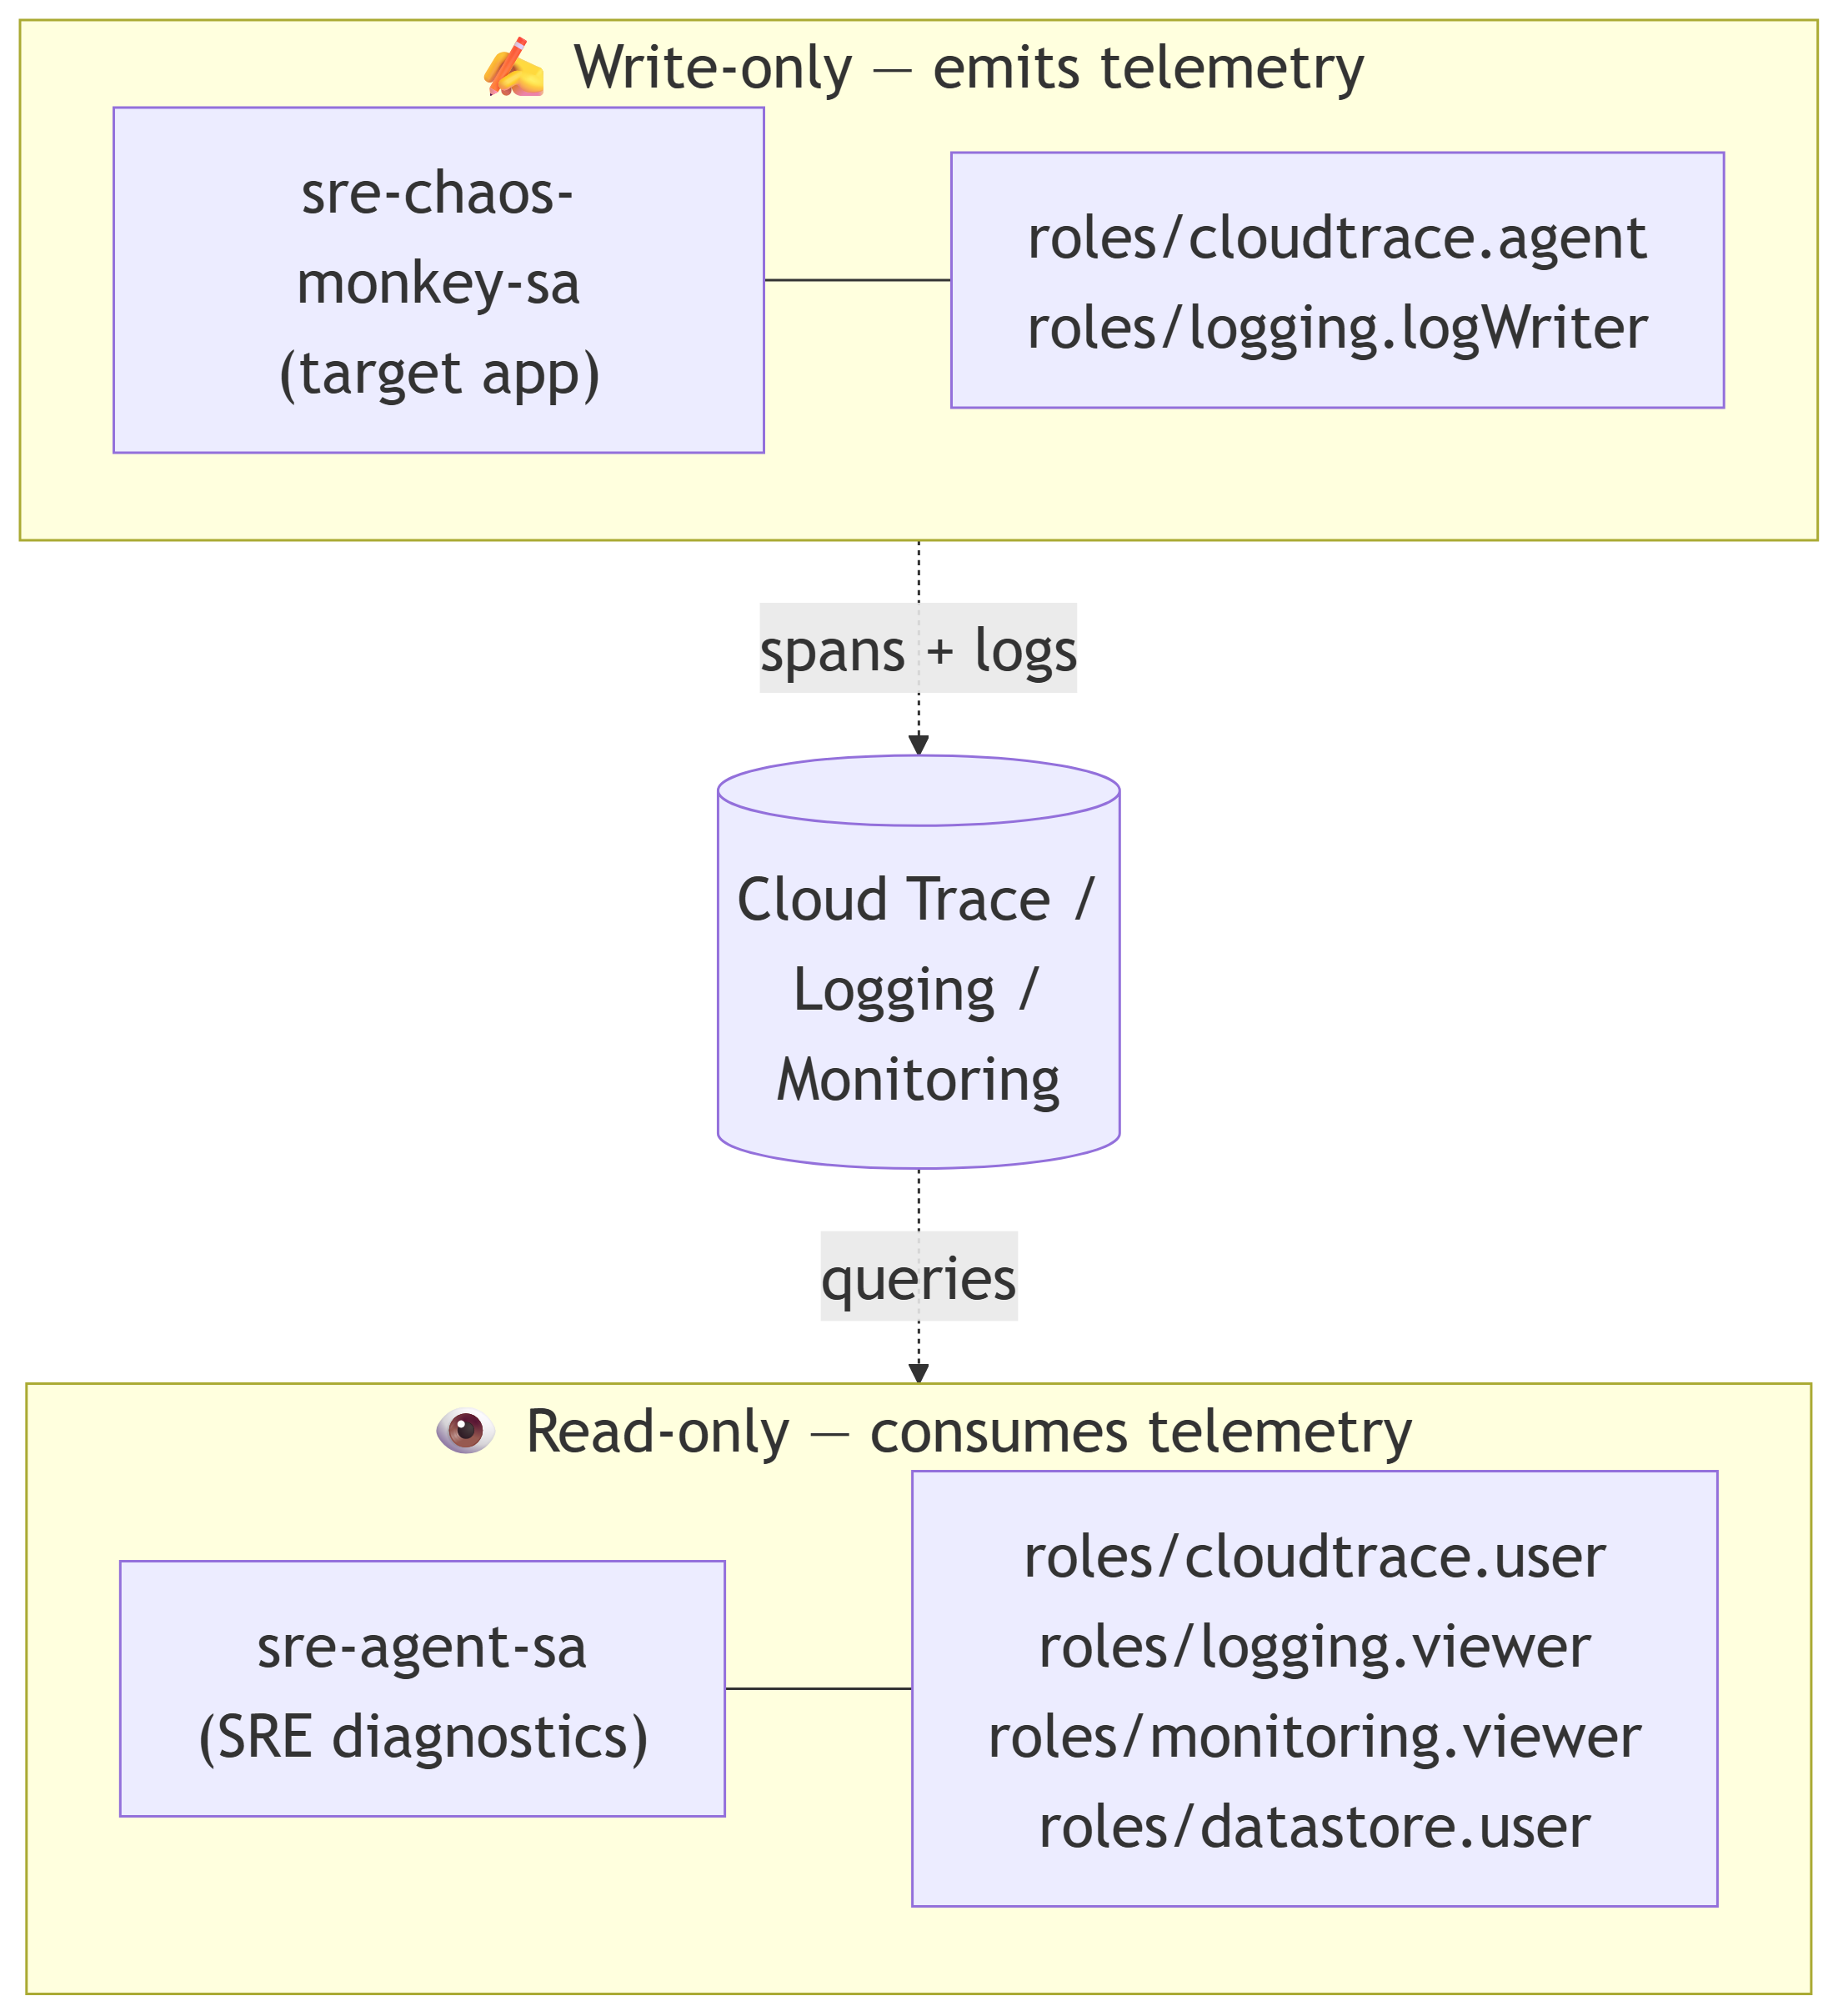 The write-only target app and the read-only SRE agent can never act on each other's plane.
The split is the whole point: the app that generates the chaos can only ever write telemetry, and the agent that investigates it can only ever read. Neither can act on the other's plane. (The deploy also provisions an inventory-agent-sa for topology discovery and a dedicated sre-build-sa for Cloud Build, each similarly scoped.)
Try It Yourself in 60 Seconds
You can run the entire scan → correlate → analyze → post-mortem loop locally. No GCP account or credentials required.
# 1. Clone the repo
git clone https://github.com/xSAVIKx/sre-agent.git
cd sre-agent

# 2. Install uv and sync the workspace (app, agent, sre_agent, inventory_agent, sre_common)
pip install uv
uv sync --all-packages

# 3. Run the incident simulation
uv run simulate_incident.py
The simulation triggers a database-timeout incident in the target app, writes mock traces and logs to mock_telemetry_data/, boots the Orchestrator in mock mode, runs the diagnostic workflow in-process, and prints the report to your terminal. You will see the structured telemetry logs (gateway → backend → database, ending in a CRITICAL ConnectionTimeoutError) followed by the full diagnosis: the 99.3% /api/database bottleneck table and the complete # 🚨 Incident Post-Mortem shown above.
Want the full multi-service experience with the web chat UI? docker-compose up --build brings up the Orchestrator, SRE agent, Inventory agent, a Firestore emulator, and the target app together — then open the chat at /chat.
Project Resources
The complete, runnable source — plus a step-by-step CODELAB that builds this from scratch — lives on GitHub:
Comments
More Blog
View allgemmaFive Gemma-4 models, one accelerator: what porting E2B 31B to AWS Inferentia2 taught me
I ported the whole Gemma-4 family — E2B, E4B, 12B, 31B, and the 26B-A4B MoE — to run on...
X
xbillcommunityHey DEV, I'm Tobore. Let's actually connect.
Hey DEV, I'm Tobore. Let's actually connect. I've been on here for a while now, mostly writing and...
L
Laurina AyarahaiI burned through thousands of AI tokens. Then a friend did it for free
(yep, kinda clickbait, just for the funsies 😊) At the beginning of the year, I relaunched my...
P
Paulo HenriqueaiClaude might be saturating your machine
My laptop was sitting idle with the fan at full tilt. Nothing was running that I knew of. The culprit...
S
Sidhant PandagithubactionsAutomated GitHub Code Reviews Using Google Gemini
I Built a Thing! TL;DR — Google Gemini-based Pull Request reviews and Issue Triaging for...
D
Darren "Dazbo" LesteraiWhat is an "agentic harness," actually?
I've been hearing the word "harness" thrown around a lot lately. I assumed it just meant "the IDE" or...
T
Tilde A. ThuriumReady-made automations for this
Workflows from the Neura Market marketplace related to this CoPilot resource
- Automate Video Production from Google Sheets with AI-Driven Promptsn8n · $14.99 · Related topic
- AI Chatbot Call Center: Taxi Booking Worker (Production-Ready, Part 5)n8n · $24.99 · Related topic
- AI-Powered Cold Call Machine with LinkedIn, OpenAI & Sales Navigatorn8n · $24.99 · Related topic
- Build Production-Ready User Authentication with Airtable and JWTn8n · $14.99 · Related topic