
Back to Blog analytics
 gemma
gemma community
 ai
ai ai
ai githubactions
 ai
ai
Google Analytics, SaaS, or self-hosted? How I chose my analytics stack
Seb Hoek January 29, 2026
0 views
Why I need user analytics In previous parts of this series, I already introduced Pausen...
Why I need user analytics
In previous parts of this series, I already introduced Pausen Games, my little browser game portal.
When developing any digital end-user product, the core questions for me are:
- How many Daily Active Users (DAU) do I have?
- What is their demographics (country, browser language)?
- What technology do they use (desktop/mobile, OS, browser)?
- How engaged are they (session length, retention)?
With this specific product, the following additional questions are relevant to me:
- Which games do my users play most?
- What are my games' completion rates?
- Which other features like profile view, highscore view etc. are they using?
To answer these questions, user analytics platforms can be used to track and aggregate user behavior in event databases and to visualize relevant metrics in beautiful dashboards.
Defining requirements before picking a tool
To understand my choice, it is relevant to discuss my context and preferences.
In this project, I am a solo developer with limited budget and limited time. Also, I don't want to place any cookie banners on my portal because I believe this distracts and annoys users.
In summary, here is what is important to me:
- Minimal consent friction in my product - no data sharing with 3rd-parties
- Access to raw events
- Ability to define custom events
- Ability visualize custom metrics
- Low operational overhead
- Reasonable cost at low to medium traffic
Now that the why and what is clearer, we can look at different solutions.
The default choice: Google Analytics
Google Analytics appears to be the obvious choice when it comes to tracking user analytics for websites and mobile applications.
Why it’s attractive
Google Analytics is popular because:
- it is free to use even at scale
- it is pretty mature
- it comes with a useful user interface with default charts and which allows to add custom charts (with limitations).
In addition, it integrates well into the rest of Google's ecosystem:
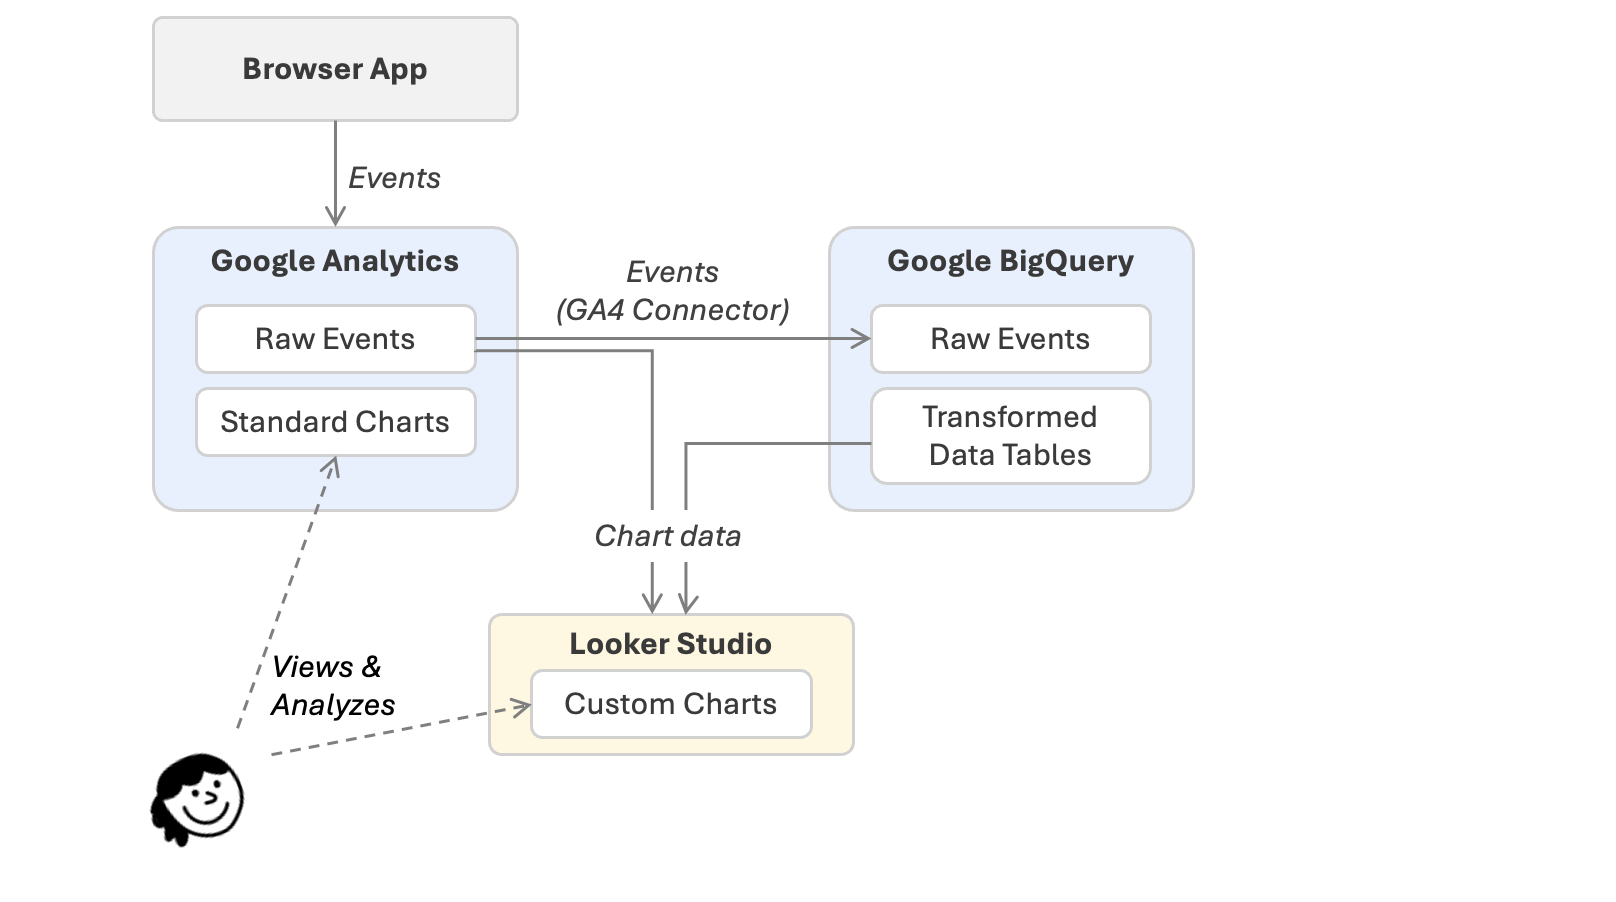
- You can use Google Looker Studio (for free) to connect to Google Analytics to create custom dashboards
- You can export the raw time series data to Google's BigQuery with a standard connector, create custom data tables using scheduled queries and connect Google Looker Studio directly to your custom data tables for complete flexibility.
From my experience, using Looker Studio directly on Google Analytics exhausts the daily query quota quickly. But even with a moderate amount of events collected over a few years and a significant number of daily scheduled queries, you can stay within the free tier of Google BigQuery, which makes this my preferred option.
The diagram below summarizes the different options to visualize and analyze user analytics events with Google Analytics.
The internet is full of (more or less) beautiful and free Looker Studio dashboards for Google Analytics as shown in the example below. They can be used as an inspiration and as a starting point for custom dashboards.
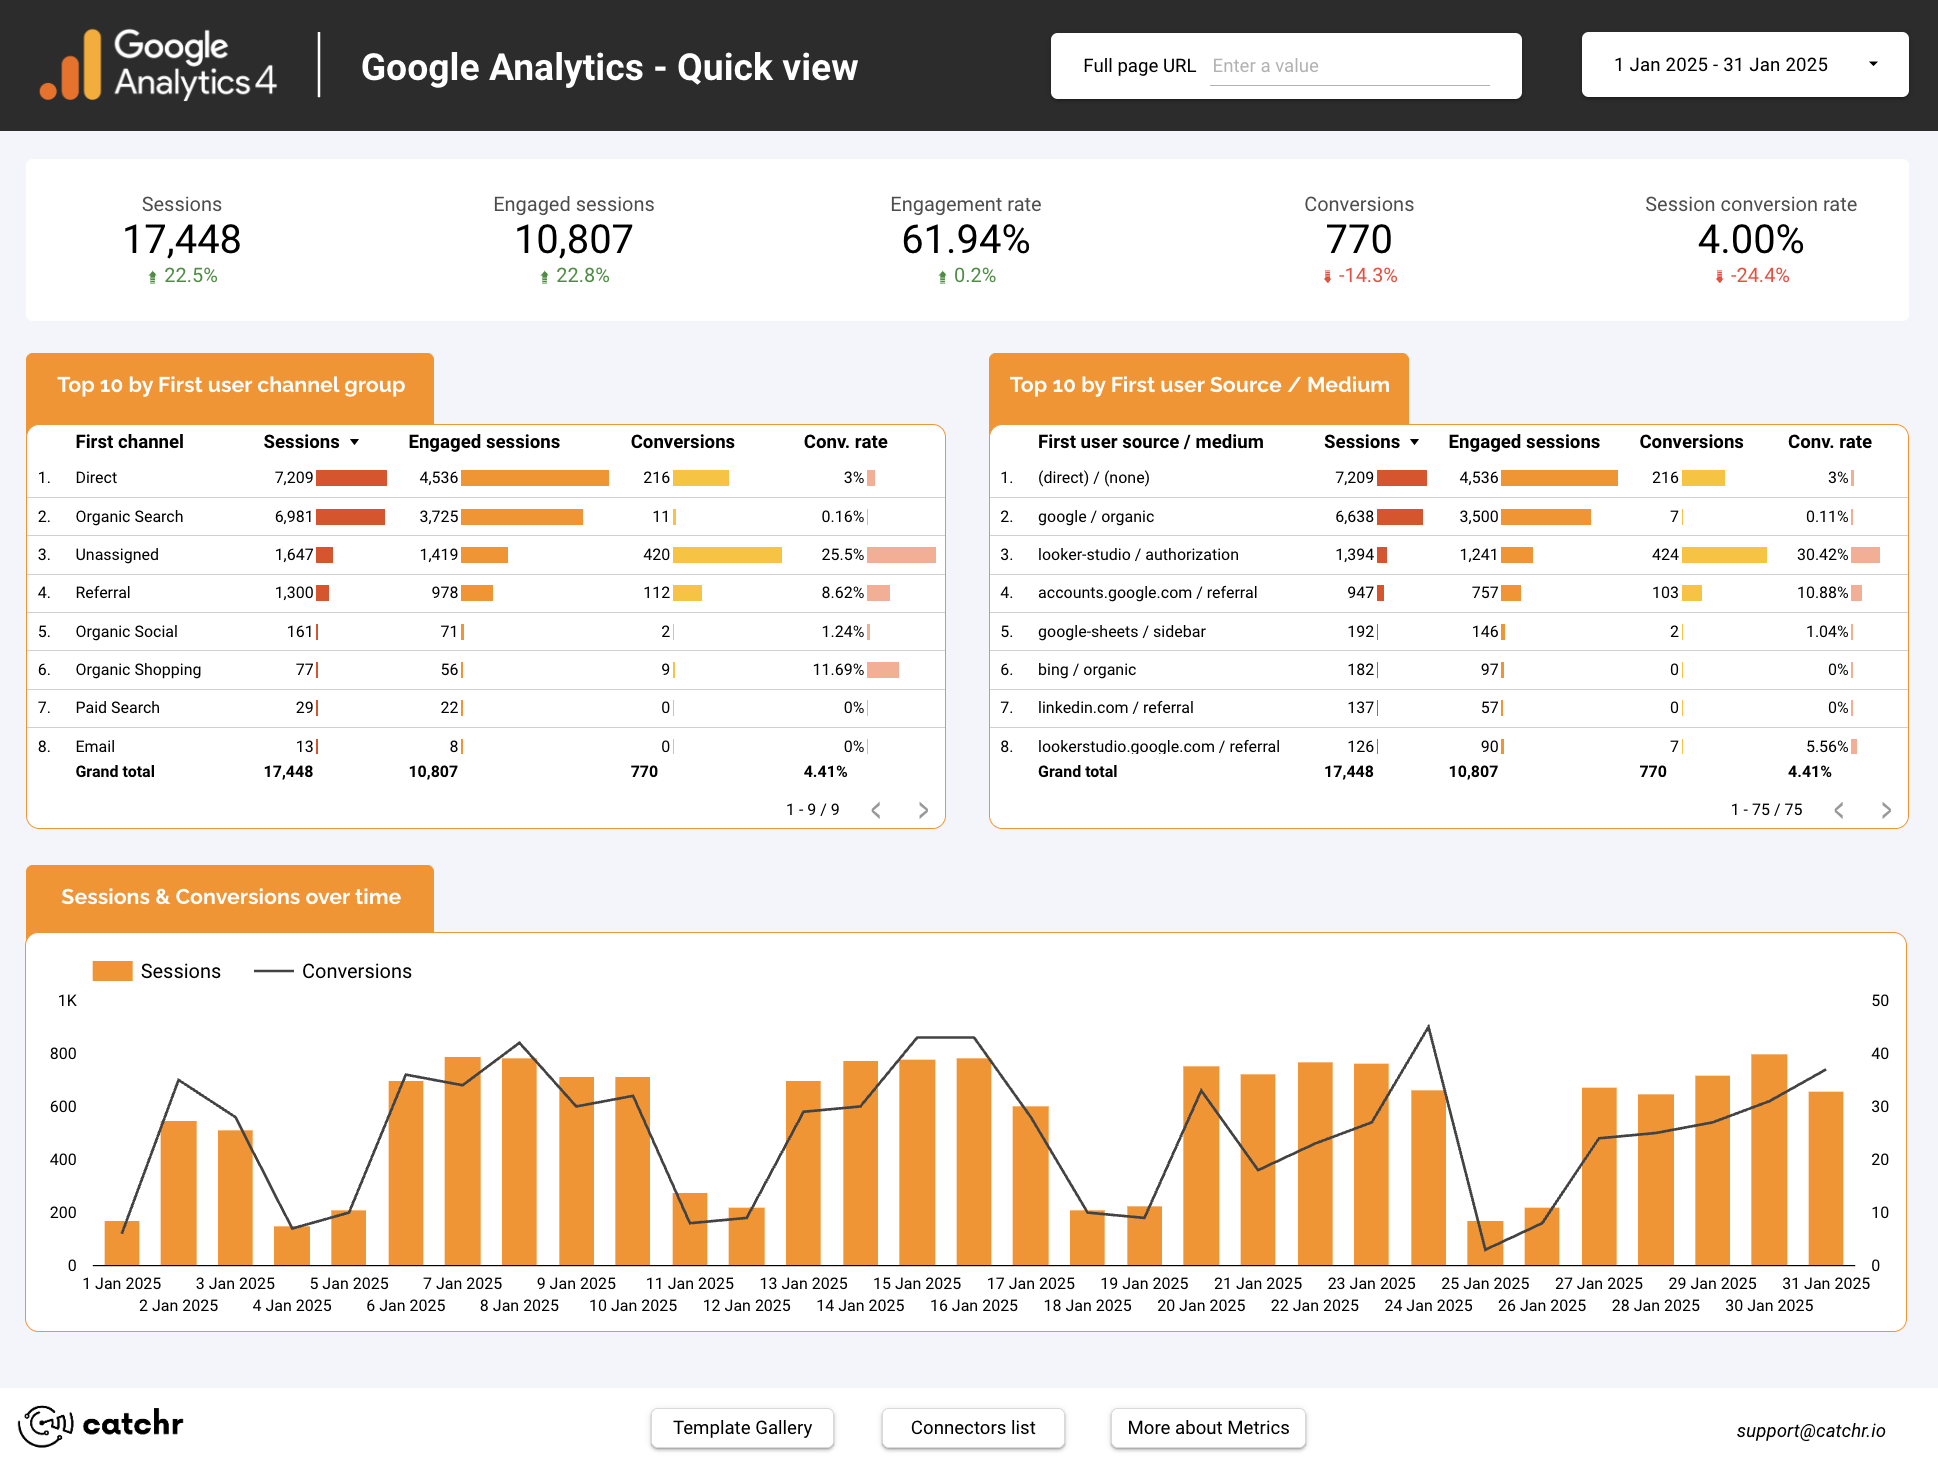
This example is randomly picked from some people on the internet; I am not affiliated.
Why it doesn’t fully fit my needs
In other projects, I use Google Analytics both for web applications and for mobile applications since many years, and it serves me well. I applied the setup with Google BigQuery and Looker Studio and I have created many insightful charts which are still driving business decisions.
The main reason why I find the use of Google Analytics problematic for new projects is the friction that it creates when my website has to ask to user to allow collecting and correlating their data by a third-party provider.
Users who choose to not participate create gaps in my user analytics data, and I believe that many users would decide to do so.
Therefore I was looking for a solution where the collected data is fully under my control, not shared with any third-party, but which still has the power and flexibility of a data warehouse with custom charts.
Option 2: Hosted analytics SaaS
I don't want to go into too much detail here to compare individual offers. The tools I looked at include:
- Plausible (hosted)
- Fathom analytics
- Simple Analytics
- PostHog Cloud
Their benefits
They all have more or less the following in common:
- Easy to set up
- Trial period or free tier to get started
- No infrastructure to manage
- Privacy-friendly default
Their limitations
Coming from my previously described setup with a custom data warehouse (Google BigQuery) and a custom charting layer (Google DataStudio), I found them all to have the following drawbacks:
- Sooner or later there will be costs, often growing as traffic grows.
- There is limited or paid access to raw data for further processing.
- The existing dashboards are opinionated and it might be tedious to visualize my KPIs the way I want.
- And still, the date is not with me but with some third-party which I need to explain to my users.
To fulfill my needs of accessing and transforming the raw data so I can create my custom charts and not sharing the data with 3rd-parties, I'd have to get my hands a bit dirty it seemed.
Option 3: Self-hosted analytics
By self-hosting a user analytics solution, I can fulfill my requirements.
I am fully in control over the selected data.
I can predict and control the costs of the approach.
I can freely transform the data to perform deeper analysis and custom visualizations.
Why I chose Plausible
While evaluating Plausible, I found that they offer an open source solution which I can download and run on my own infrastructure.
I liked the simple and straight-forward programming model of collecting the events which works across programming languages and also include mobile applications. Tracking multiple applications and adding custom events is very easy.
It seemed to be lightweight enough to run on a small virtual machine.
I am not going into the details of self-hosting Plausible. If you you interested, let me know and I can create a dedicated post about it. If you want to get started, check out their Getting Started repository with a handy Docker compose file.
By self-hosting the the solution and therefore also the collected data, I implement a privacy-friendly approach where I don't share any data with 3rd-parties.
Out of the box, Plausible provides a few useful charts, but again I had the appetite to access to the raw data, transform it into different shapes, to calculate additional KPIs and to visualize them.
The screenshot below shows how my self-hosted Plausible instance provides basic insights into how users find and use my gaming portal.
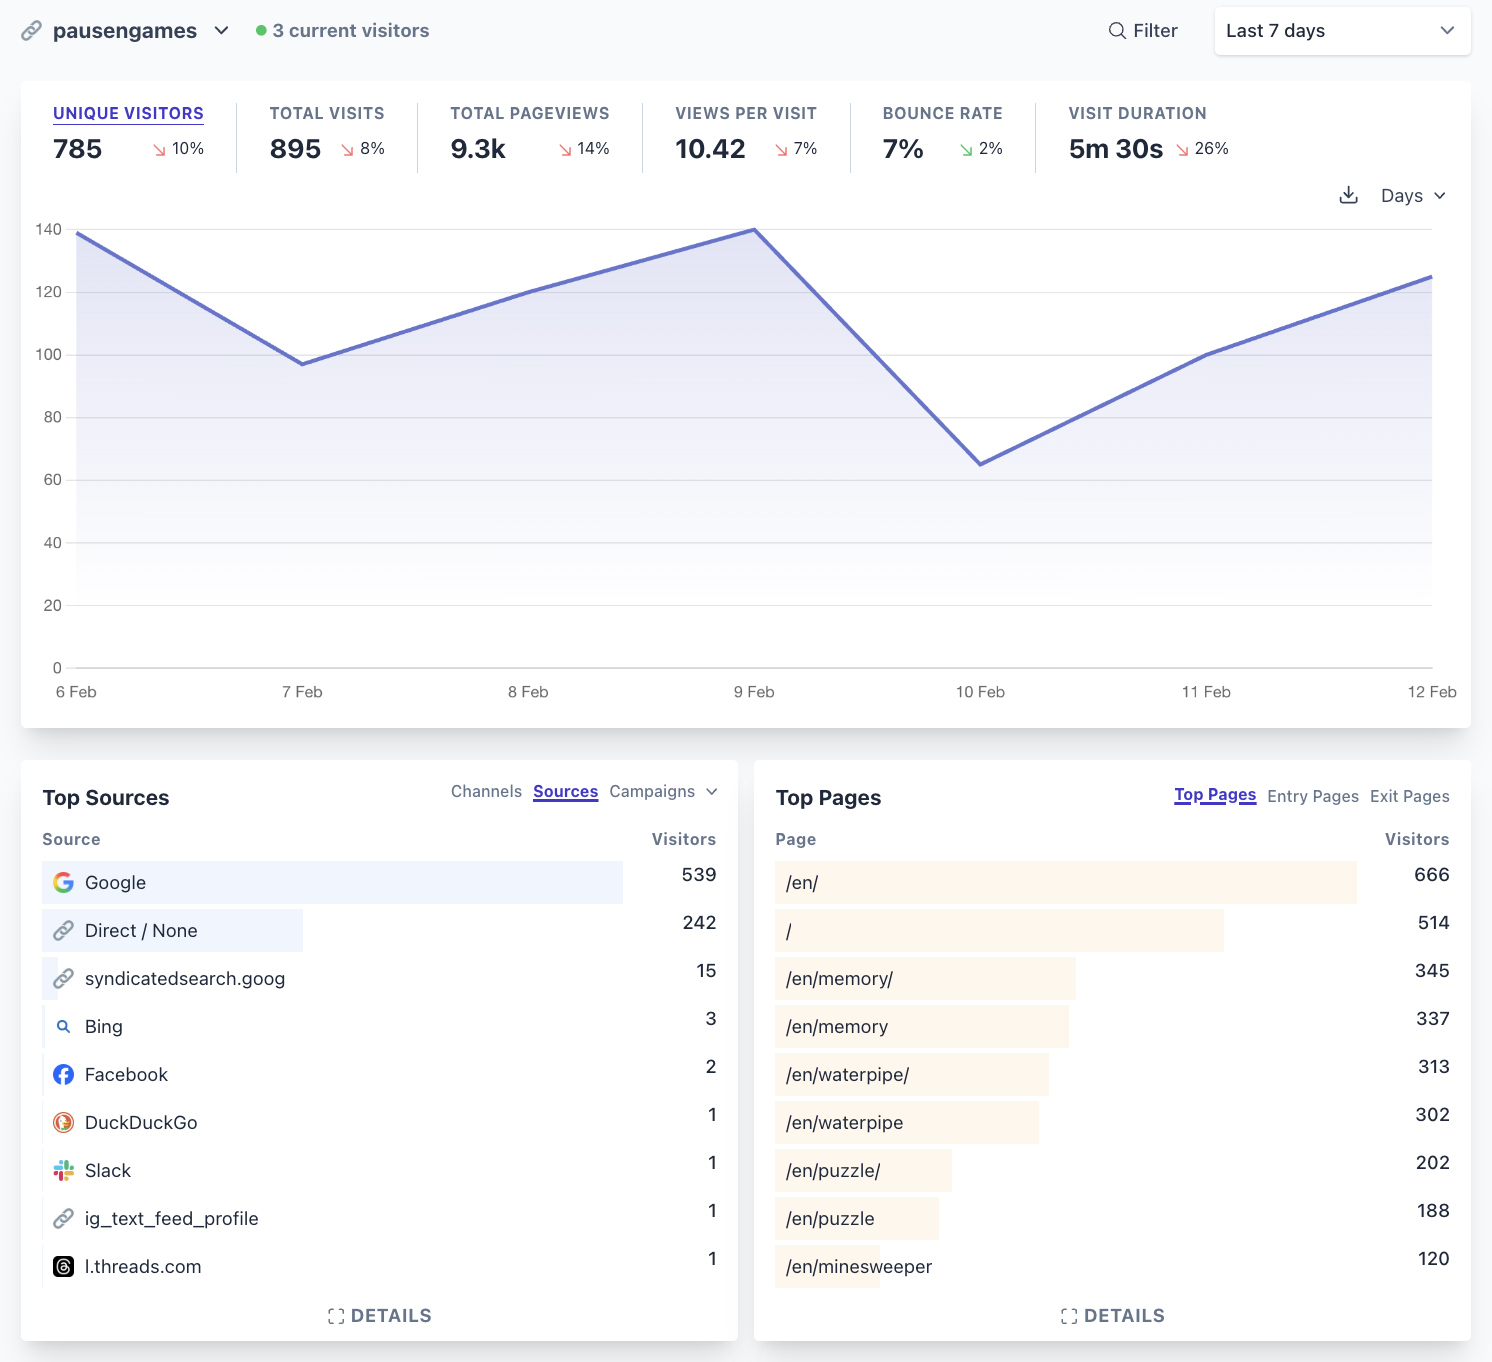
With this setup in place, I was ready to take my user analytics to the level I envisioned.
Connecting a data warehouse and custom charts
To visualize my custom KPIs in Google's Looker Studio, I had to find a way to export the raw data in a data source Looker Studio can read out of the box and which I can use without any costs.
Finally, I found a project where I could apply the knowledge I acquired for my (already expired) Google Cloud Architect certification!
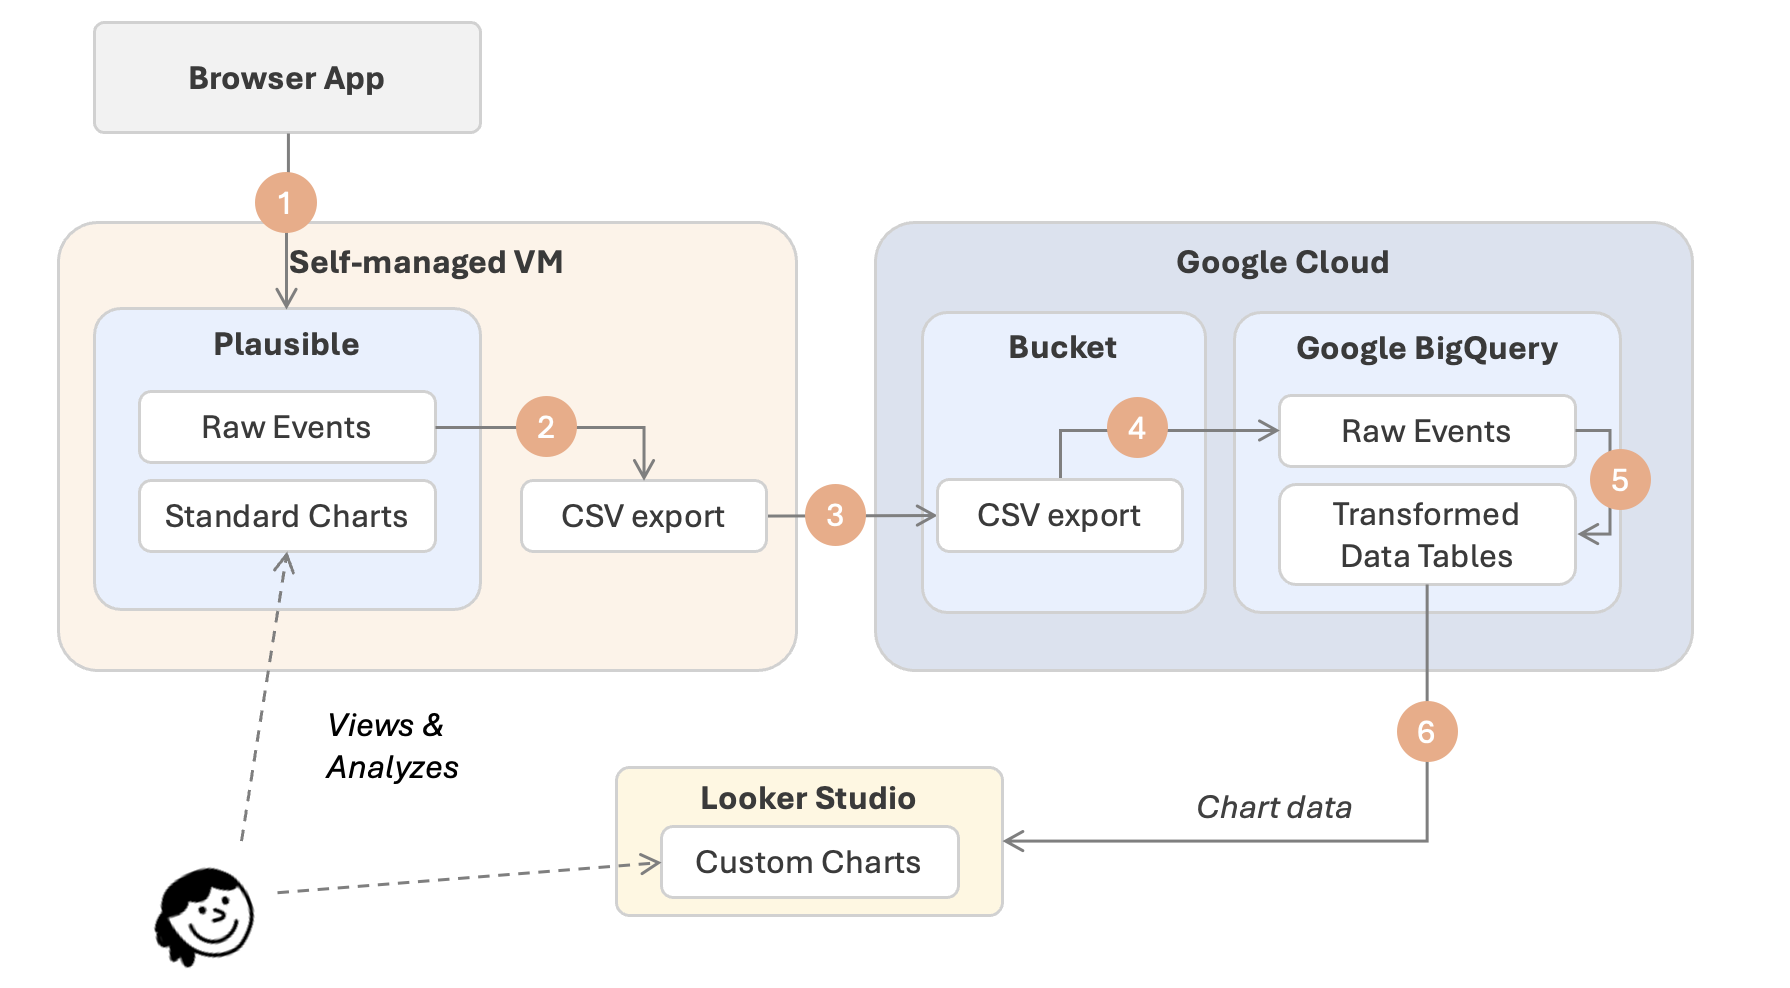
Here is my approach:
- (1) From my application, user analytics events are sent to my self-hosted Plausible instance.
- (2) In my VM, set up a cron job that exports yesterday's raw analytics events into a CSV file.
- (3) After the export, the CSV file is copied to a Google Bucket (cloud storage).
- (4) A Google Cloud Function detects the arrival of the file and appends its content into an existing time-series table in Google BigQuery.
While I could now set up Looker Studio directly to the raw events table in Google BigQuery, I found the schema a bit too complex to visualize easily.
(5) Therefore I set up scheduled queries in BigQuery which extract the raw data and transform it into a schema that is much easier to visualize in Looker Studio.
In these scheduled queries, I could:
- omit irrelevant columns,
- flatten nested attributes, for example from events,
- pre-calculate relevant columns, for example the session number of a specific user.
(6) Finally, I could connect Google Looker Studio directly to the transformed data in my BigQuery and define the charts I wanted.
The overall approach is depicted in the diagram below.
I have to admit that using my favorite LLM chat has significantly accelerated the design and implementation of this architecture.
Creating complex, somewhat correct and efficient SQL queries for BigQuery was something that had cost me hours and days in the past.
With the tools available today, this is still nothing that works on the first attempt, but the overall speed of bootstrapping queries and understanding and debugging problems is at a different order of magnitude.
With this setup in place, I could start defining the charts I wanted.
What I can answer now (that I couldn’t before)
In addition to the charts that Plausible provides by default, I wanted to answer the following questions:
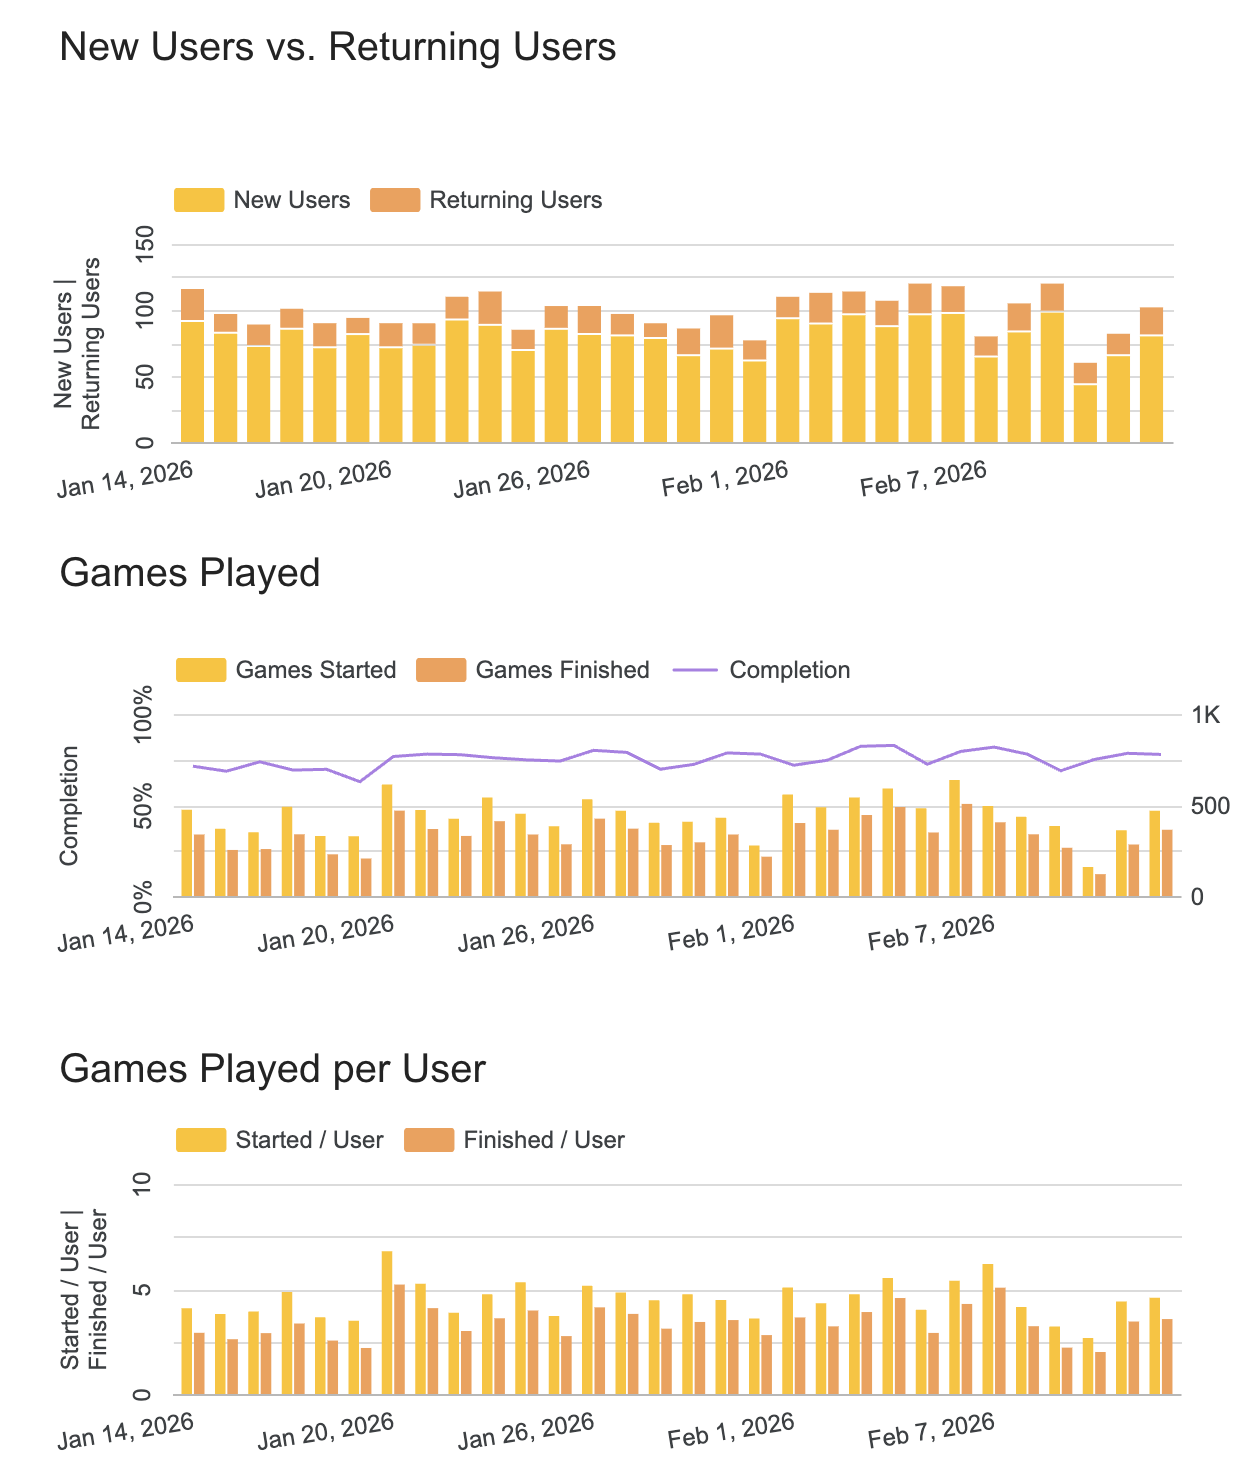
- From the daily active users (DAU), how many are new users and how many are returning users from previous days?
- For every day, how many games are played in total?
- In average, how many games are users playing per day?
- What is the completion rates of my games? How many games are actually finished compared to how many were started?
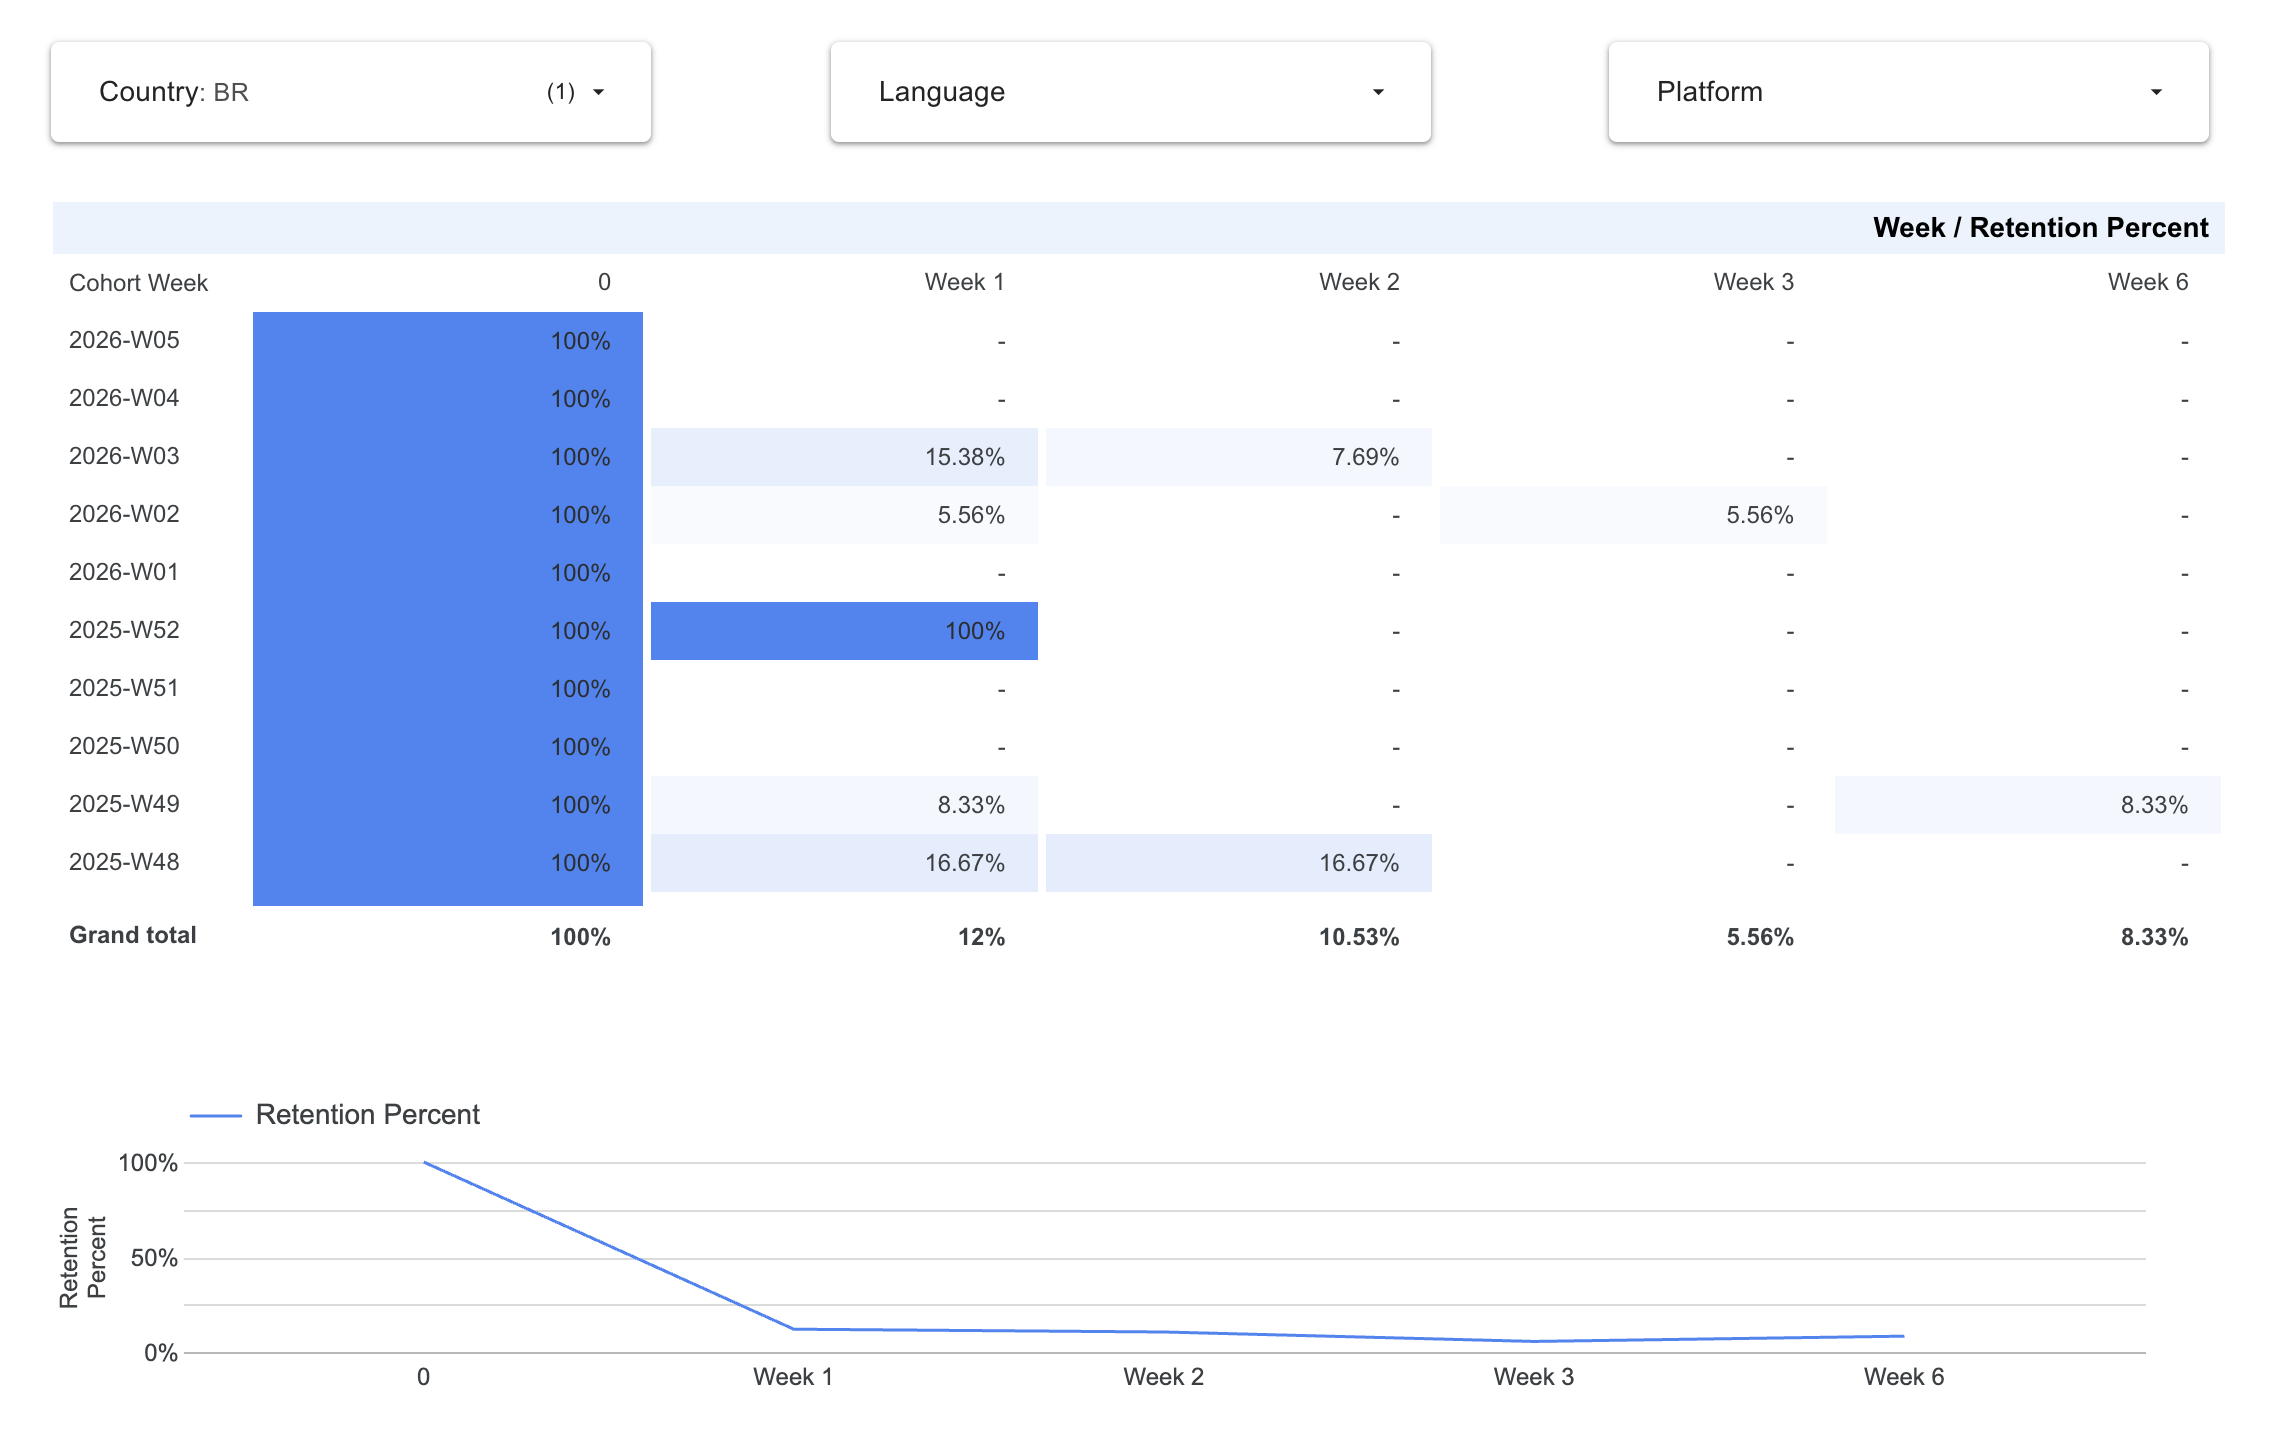
- And most difficult: What is my weekly retention rate? (Meaning: For every user cohort that joined a specific week, what are the return rates for the second, third, and the following weeks?
Now answering these questions just means creating a custom scheduled query that produces the time-series events with the relevant data in BiqQuery, scheduling this query for a daily (or weekly) run, and connecting a chart in Looker Studio to visualize the data on a timeline.
Below you can find two real-life examples of charts I defined to answer the above questions. As you can see, some metrics still leave a lot of room for inmprovements :) (which I will be talking about in a different post).
This flexibility however comes at some costs as I will discuss in the following chapter.
The tradeoff I accepted
Self-hosting a user analytics stack does not come for free. Here are some of the costs (I am willing to accept):
- Running and maintaining a VM costs money and time. Currently, I still pay around EUR 6 per month for a VM with 8GB RAM, for vCPUs and 120GB disk. I had to increase the VM and disk after a while because the smaller ran out of capacity.
- There is a considerable amount of work to be invested for the initial setup of the stack (even with the help of smart and confident AI chats).
- It is essential to spend a few thoughts security considerations. A self-managed VM exposed to the internet should not go without solid protection.
- I am responsible for data backups and regularly updating the stack.
Conclusion
Overall, and that's my conclusion, spending the additional effort to set up a self-hosted user analytics solution and connect it to a managed data warehouse and charting tool is absolutely worth it for me.
I believe I achieved my goals, I had fun setting this up and I might have learned something on the way.
Although I have some monthly costs and some maintenance work, the additional insights I gain into user behavior and the fact that I don't need to share user analytics data with 3rd-parties outweigh the drawbacks for me.
User analytics gives me the insights I need to understand the weaknesses of my product and the impact of new features I released.
In future posts, I’ll talk about how I’m continuing to work on my Pausengames portal.

Comments
More Blog
View allgemmaFive Gemma-4 models, one accelerator: what porting E2B 31B to AWS Inferentia2 taught me
I ported the whole Gemma-4 family — E2B, E4B, 12B, 31B, and the 26B-A4B MoE — to run on...
X
xbillcommunityHey DEV, I'm Tobore. Let's actually connect.
Hey DEV, I'm Tobore. Let's actually connect. I've been on here for a while now, mostly writing and...
L
Laurina AyarahaiI burned through thousands of AI tokens. Then a friend did it for free
(yep, kinda clickbait, just for the funsies 😊) At the beginning of the year, I relaunched my...
P
Paulo HenriqueaiClaude might be saturating your machine
My laptop was sitting idle with the fan at full tilt. Nothing was running that I knew of. The culprit...
S
Sidhant PandagithubactionsAutomated GitHub Code Reviews Using Google Gemini
I Built a Thing! TL;DR — Google Gemini-based Pull Request reviews and Issue Triaging for...
D
Darren "Dazbo" LesteraiWhat is an "agentic harness," actually?
I've been hearing the word "harness" thrown around a lot lately. I assumed it just meant "the IDE" or...
T
Tilde A. ThuriumReady-made automations for this
Workflows from the Neura Market marketplace related to this DeepSeek resource
- Automate AI analysis of Google Analytics user and session data by country with ChatGPTmake · $4.99 · Related topic
- Create a Self-Hosted URL Shortener with Dashboard and Analyticsn8n · $14.99 · Related topic
- Send country-based user & session report from Google Analytics to Google Sheetsmake · $2.99 · Related topic
- Compare Multi-Period Financial Data from Google Sheets with DeepSeek AI Analysisn8n · $14.99 · Related topic