Back to Blog sql
sql gemma
gemma community
 ai
ai ai
ai githubactions
 ai
ai
Finding Slow Queries in PostgreSQL (Without Guessing)
Labeeb Ahmad March 28, 2026
0 views
Here’s the quantitative method used by DBAs and tools like pganalyze and AWS Performance...
Here’s the quantitative method used by DBAs and tools like pganalyze and AWS Performance Insights.
Connect to your database and create the extension:
CREATE EXTENSION IF NOT EXISTS pg_stat_statements;
Then tell PostgreSQL to load it at startup. The easiest way is with ALTER SYSTEM (no need to edit config files):
ALTER SYSTEM SET shared_preload_libraries = 'pg_stat_statements';
Now restart PostgreSQL. If you’re using Docker:
docker restart <your-pg-container-name>
The extension now tracks every query, grouping similar ones together.
Find the Queries That Cost the Most
After the restart, run some queries so the extension collects data. Then run:
SELECT
    query,
    calls,
    round(total_exec_time::numeric, 2) AS total_ms,
    round(mean_exec_time::numeric, 2) AS avg_ms,
    round((100 * total_exec_time::numeric /
          sum(total_exec_time::numeric) OVER ())::numeric, 2) AS pct_of_total
FROM pg_stat_statements
ORDER BY total_exec_time DESC
LIMIT 10;
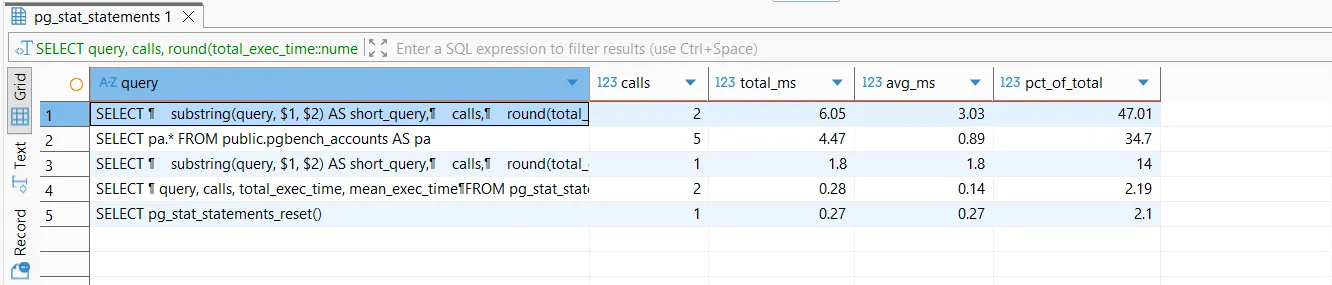
The pct_of_total column shows what percentage of your database’s total execution time that query pattern represents. If a query shows 50% there, optimizing it could cut your database load in half.
Note: pg_stat_statements accumulates data until reset. To get fresh trends, reset with SELECT pg_stat_statements_reset(); before measuring.
Decide How to Fix It
Look at the avg_ms column:
-
If avg_ms is high (e.g., >100ms), the query itself is slow. Use EXPLAIN ANALYZE to find missing indexes or inefficient joins.
-
If avg_ms is low but calls is huge, the query is cheap per call but called too often. Reduce calls via caching, batching, or fixing N+1 queries.
Your threshold for "high" depends on your app's latency requirements & context.
No more guessing. With **pg_stat_statements **you can:
See which queries consume the most total CPU time.
Distinguish between slow queries and too‑frequent queries.
This approach is data‑driven, repeatable, and used in production every day. When things get slow, you’ll know exactly where to start.
Comments
More Blog
View allgemmaFive Gemma-4 models, one accelerator: what porting E2B 31B to AWS Inferentia2 taught me
I ported the whole Gemma-4 family — E2B, E4B, 12B, 31B, and the 26B-A4B MoE — to run on...
X
xbillcommunityHey DEV, I'm Tobore. Let's actually connect.
Hey DEV, I'm Tobore. Let's actually connect. I've been on here for a while now, mostly writing and...
L
Laurina AyarahaiI burned through thousands of AI tokens. Then a friend did it for free
(yep, kinda clickbait, just for the funsies 😊) At the beginning of the year, I relaunched my...
P
Paulo HenriqueaiClaude might be saturating your machine
My laptop was sitting idle with the fan at full tilt. Nothing was running that I knew of. The culprit...
S
Sidhant PandagithubactionsAutomated GitHub Code Reviews Using Google Gemini
I Built a Thing! TL;DR — Google Gemini-based Pull Request reviews and Issue Triaging for...
D
Darren "Dazbo" LesteraiWhat is an "agentic harness," actually?
I've been hearing the word "harness" thrown around a lot lately. I assumed it just meant "the IDE" or...
T
Tilde A. ThuriumReady-made automations for this
Workflows from the Neura Market marketplace related to this DeepSeek resource
- Email Assistant: Convert Natural Language to SQL Queries with Phi4-mini and PostgreSQLn8n · $14.99 · Related topic
- PostgreSQL Conversational Agent with Claude & DeepSeek (Multi-KPI, Secure)n8n · $14.99 · Related topic
- Automate PostgreSQL Queries and Visualizations with AI-Driven Insightsn8n · $14.99 · Related topic
- Automate SQL Queries on Google Sheets Data Using AI and PostgreSQLn8n · $14.99 · Related topic