Back to Blog javascript
 ai
ai ai
ai ai
ai go
go playwright
 cli
cli
billboard.js 3.18.0: Arc annotations, per-group normalization & enhanced treemap labels
Jae Sung Park January 23, 2026
0 views
This 3.18.0 release introduces powerful new features that expand chart visualization capabilities....
This 3.18.0 release introduces powerful new features that expand chart visualization capabilities. From arc annotations for pie/donut charts to per-group stack normalization and enhanced treemap label formatting - this release addresses key community requests.
> For the detailed release info, please check out the release note:
> https://github.com/naver/billboard.js/releases/tag/3.18.0
## 📌 What's new?
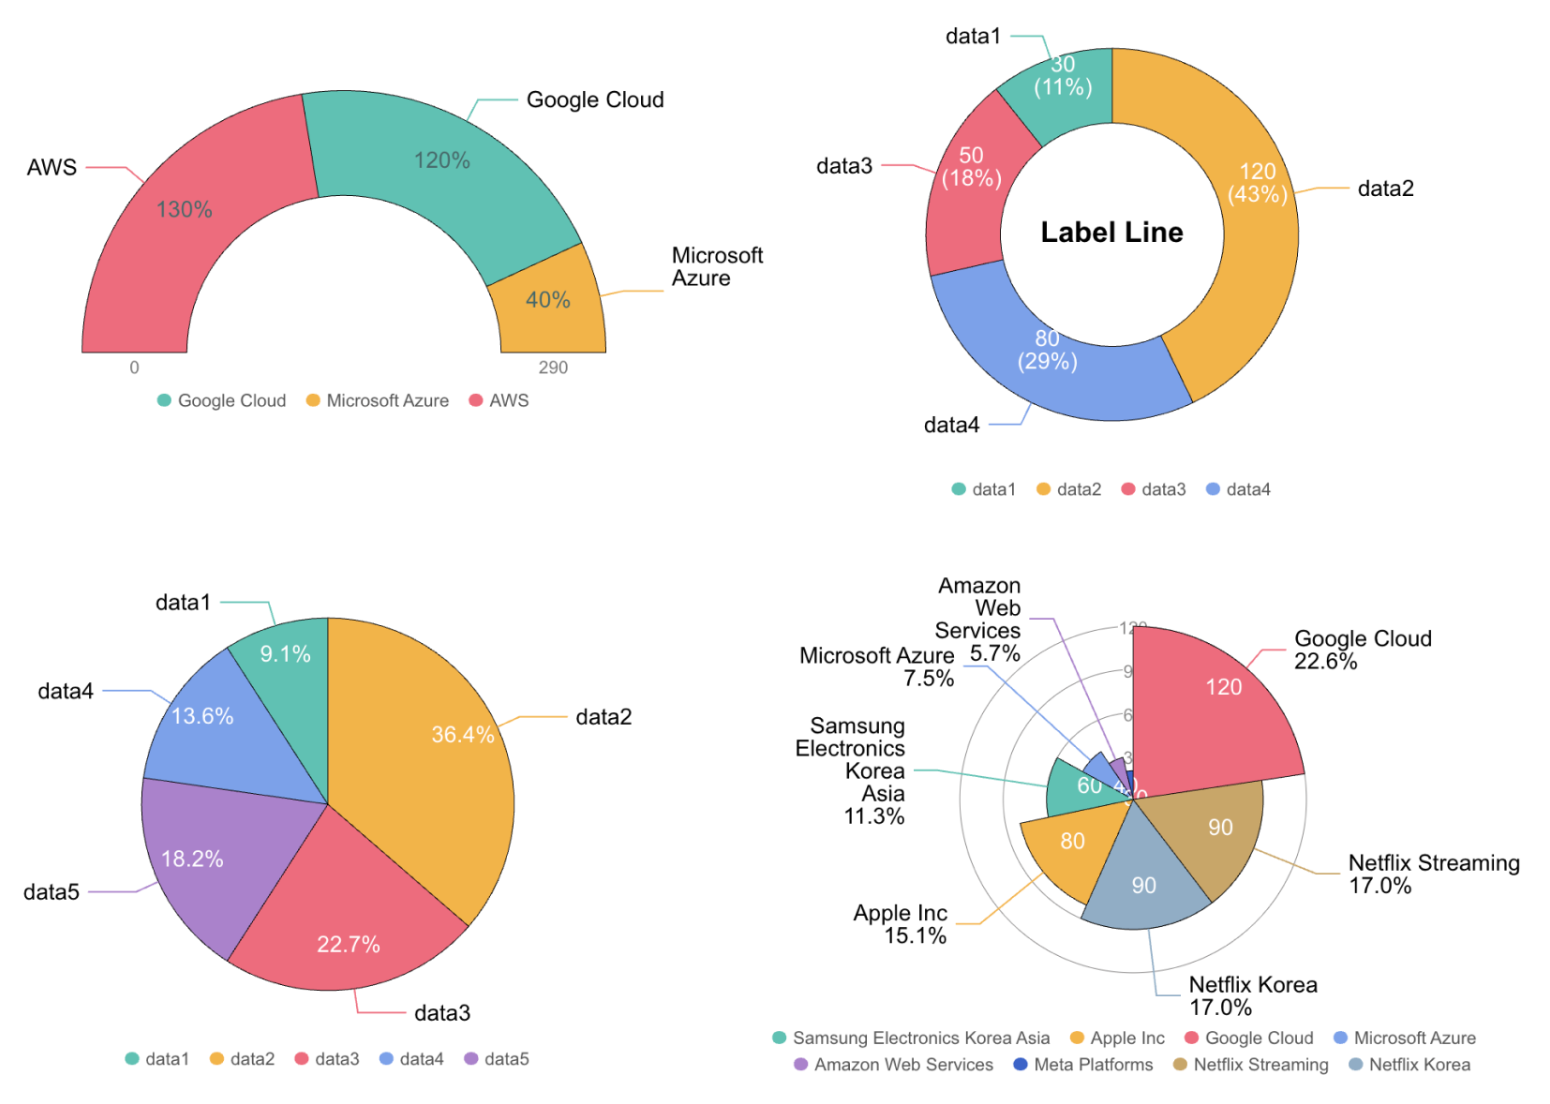
### 1. Arc annotation labels (label.line)
A long-awaited feature request from the community! Display annotation labels with connecting lines outside the arc segments.
This enhances readability by placing labels clearly outside the chart, connected with visual lines to their corresponding sections.
```javascript
const chart = bb.generate({
data: {
columns: [
["data1", 30],
["data2", 120],
["data3", 50]
],
type: "pie"
},
pie: {
label: {
format: function(value, ratio, id) {
return id + ": " + (ratio * 100).toFixed(1) + "%";
},
line: {
show: true, // Enable annotation lines
distance: 30, // Distance of labels from the arc
text: true // Show text labels (can be a function)
}
}
}
});
```
Works with: `pie`, `donut`, `gauge`, `polar` chart types.
> Demo:
> - https://naver.github.io/billboard.js/demo/#PieChartOptions.LabelLine
> - https://naver.github.io/billboard.js/demo/#GaugeChartOptions.LabelLine
> - https://naver.github.io/billboard.js/demo/#PolarChartOptions.LabelLine
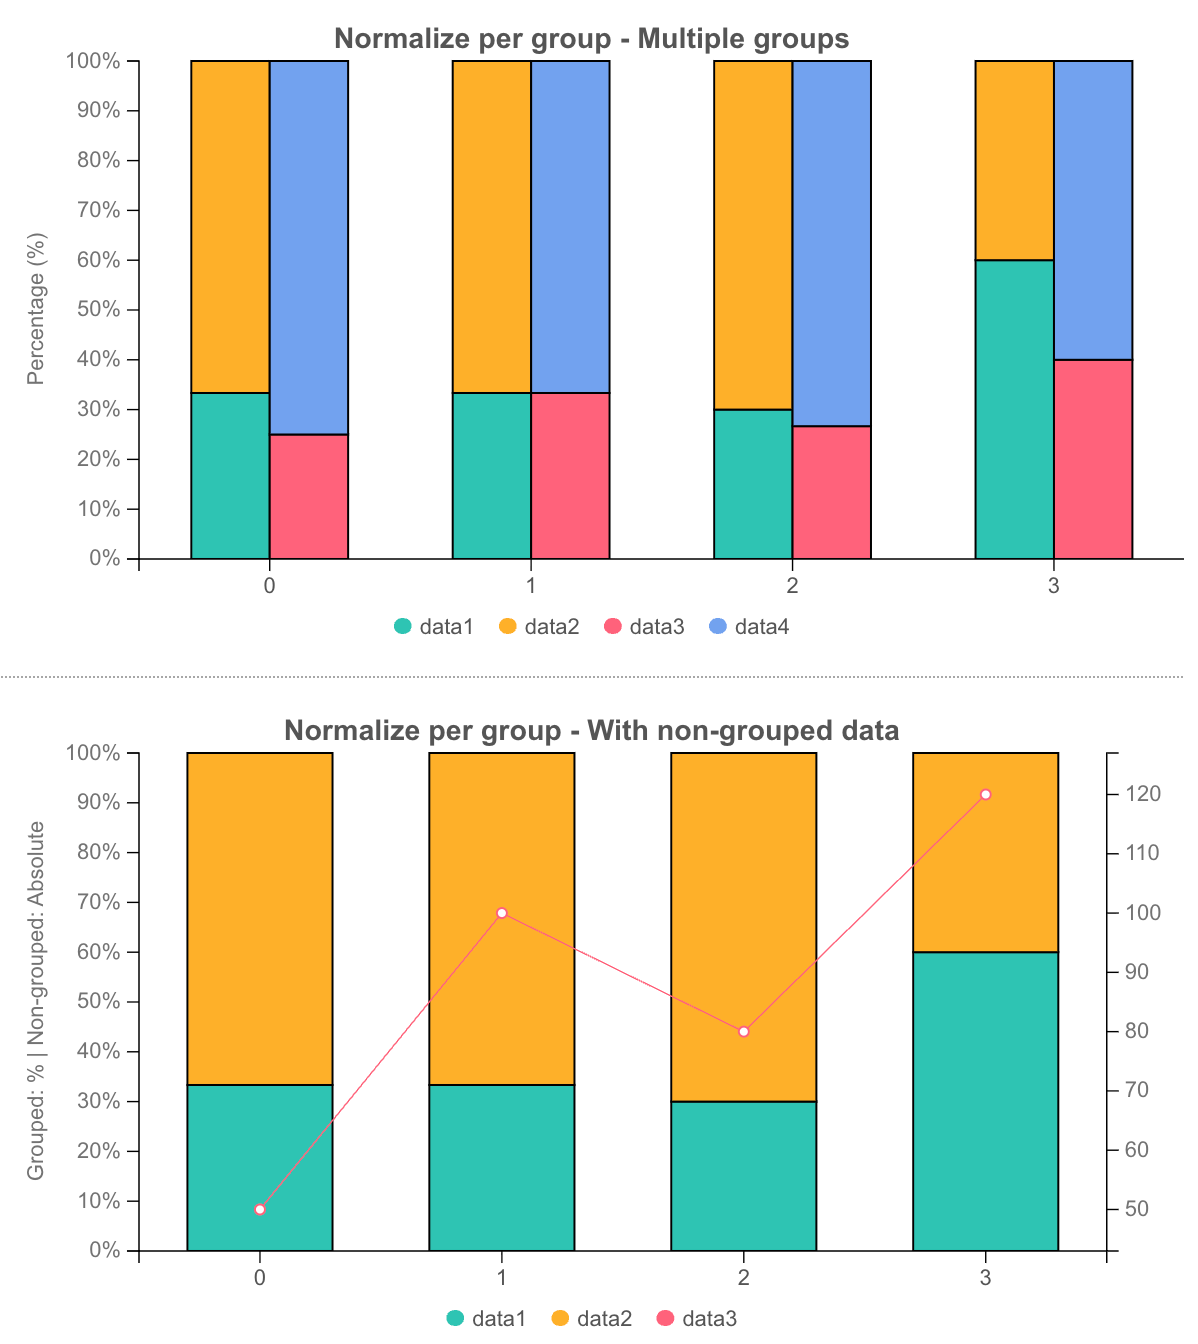
### 2. Per-group stack normalization (data.stack.normalize.perGroup)
When using `stack.normalize: true`, the existing behavior sums up all column values regardless of which axis the series is assigned to.
This new option allows each group to normalize independently to 100%, which is essential when you have stacked bars on the y-axis and a separate line series on the y2-axis that shouldn't affect the normalization.
```javascript
const chart = bb.generate({
data: {
columns: [
["data1", 30, 200, 100],
["data2", 130, 100, 140],
["data3", 60, 80, 120],
["data4", 200, 150, 100]
],
type: "bar",
groups: [
["data1", "data2"],
["data3", "data4"]
],
stack: {
normalize: {
perGroup: true // Each group normalizes independently to 100%
}
}
}
});
```
> Demo:
https://naver.github.io/billboard.js/demo/#Data.DataStackNormalizedGroup
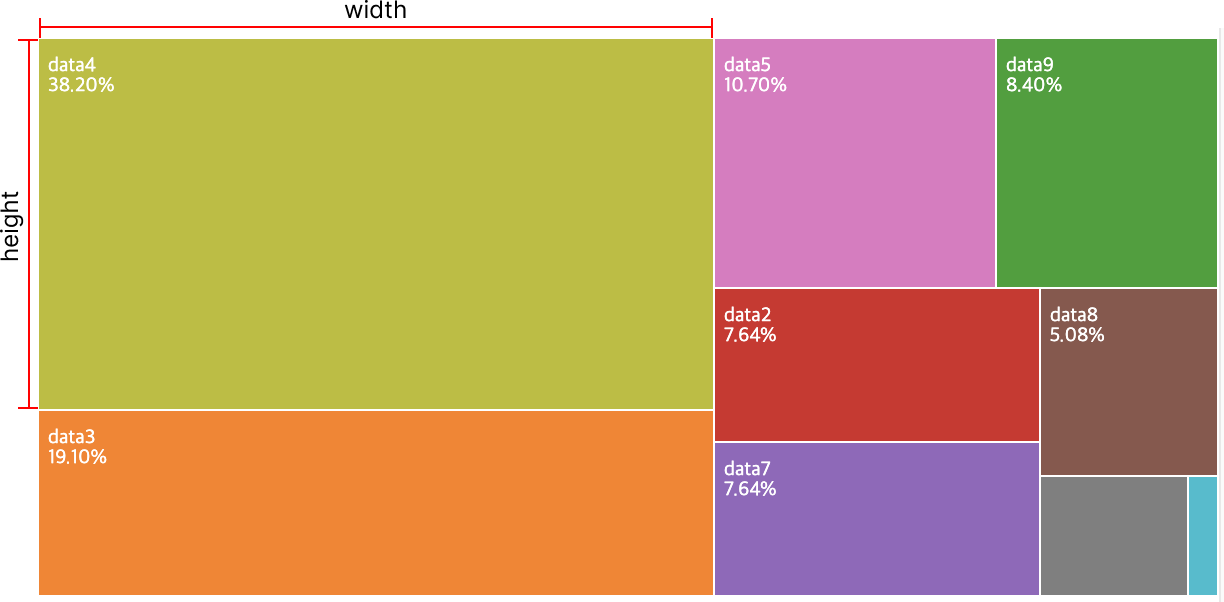
### 3. Treemap label formatter with tile size
Previously, the `treemap.label.format` function only received `value`, `ratio`, and `id` parameters. While `ratio` was useful, it doesn't reflect the actual rendered dimensions.
Now the formatter receives the tile's real width and height in pixels, allowing you to conditionally render labels based on available space.
```javascript
const chart = bb.generate({
data: {
columns: [
["data1", 1000],
["data2", 500],
["data3", 300],
["data4", 200]
],
type: "treemap",
labels: {
// format(value, ratio, id, size)
// - size: { width, height } in pixels
format: function(value, ratio, id, size) {
if (size.width < 50 || size.height < 30) {
return ""; // Hide label if tile is too small
}
return id + "\n" + value;
}
}
}
});
```
For example, the `size` argument will contain each data's square dimension. From the below screenshot, `data1`'s width and height value will be passed to the size object.
## 👋 Going forward
New features added and improvements fine-tune responsive behavior and visual clarity — building toward a more flexible, developer-friendly charting core. Keep the feedback coming on GitHub and community(medium & dev.to) channels!
Happy charting!
Comments
More Blog
View allaiHow I'm using ASTs and Gemini to solve the "Codebase Onboarding" problem 🧠
Hi everyone! 👋 I’m Tara, a Senior Software Engineer and Consultant. Over the years, I've jumped...
T
tworrellaiLocal AI Will Save Us All (The Math Says So, Trust Me)
Every few weeks a take goes viral in tech circles making the case for ditching cloud AI and running...
S
Sebastian SchürmannaiLost in the AI Hype, I Started Small
And it helped me get back into tech without drowning TL;DR at the end Coming back to...
R
Rohini GaonkargoBuilding a Replay-Tested Interactive Brokers Client in Go
I wanted an IBKR library that felt like Go and had testing I could trust. So I wrote one.
T
Thomas MarcelisplaywrightPlaywright in Pictures: Fully Parallel Mode
Playwright’s fullyParallel mode is often treated as a simple performance switch. In practice, it...
V
Vitaliy PotapovcliDesigning a CLI for Both Humans and Agents
Learn how Alpic designed its CLI for both human developers and AI agents — covering tradeoffs like polling, context windows, interactivity, and statelessness.
J
Julien Vallini