Back to Blog gpu
gpu
 gemma
gemma community
 ai
ai ai
ai githubactions
 ai
ai
Beyond nvidia-smi part — 1
Yash Panchal February 19, 2026
0 views
Common pitfalls and methods to measure GPU efficiency. This will be a two part series...
Common pitfalls and methods to measure GPU efficiency.
This will be a two part series regarding monitoring a GPU
GPUs are much simple compared to CPUs
Bunch of simple compute intensive hardware but in a massive proportion relative to memory and other decoder components within the same chipset.
GPU = Compute (Massive portion of the chip) + Memory + Decoders
Compute is commonly refered to Streaming Multiprocessors (SM) in case of NVIDIA GPUs
Monitoring normal servers vs GPUs:
One can monitor normal linux server using utilities like htop/top or using exporters like node-exporter to get basic usage idea like CPU% RAM no of VCPUs, etc.
However GPUs are not that staightforward to monitor.
Common bad habit that one might encounter is to use nvidia-smi utility just like we use htop/top.
Though it will work for identifying if GPU is doing any work at all, it won't give you any idea regarding efficiency of your GPU.
So what are these common mistakes ?
1. Relying solely on nvidia-smi
nvidia-smi is a nice utility, however when it comes to monitoring your GPU metrics it is myopic.
The GPU-Util % that you see using nvidia-smi tells you if any CUDA kernel is active at a point in time, It will not help you in identifying efficiency of your GPU.
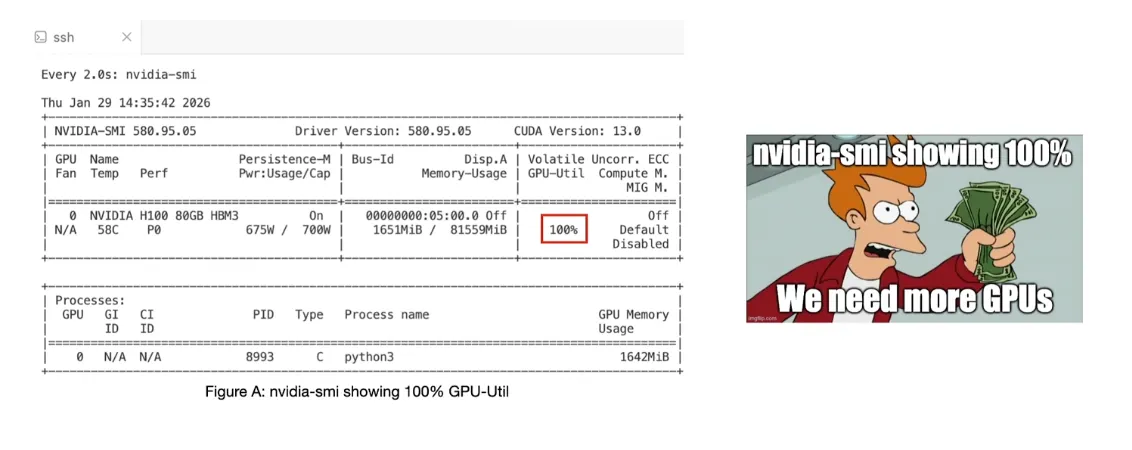 <sub>Figure A taken from my FOSDEM 26 talk: Beyond nvidia-smi: Tools for Real GPU Performance Metrics https://fosdem.org/2026/schedule/event/BBYZLU-gpu-performance-monitoring/</sub>
Even if you would be doing a simple matrix multiplication on an H100 GPU you will still see GPU-Util to be at 100%.
This is something that might lead a newbie to conclude that the GPU is being fully used.
One such example is trying to run a Wan2.2 TI2V 5B parameter video generation model on an 80GB H100 GPU, You might see 23GB VRAM usage but 100% GPU-Util using nvidia-smi will make you question the efficiency of your GPU compute.
Case of FP16 vs FP32 performance:
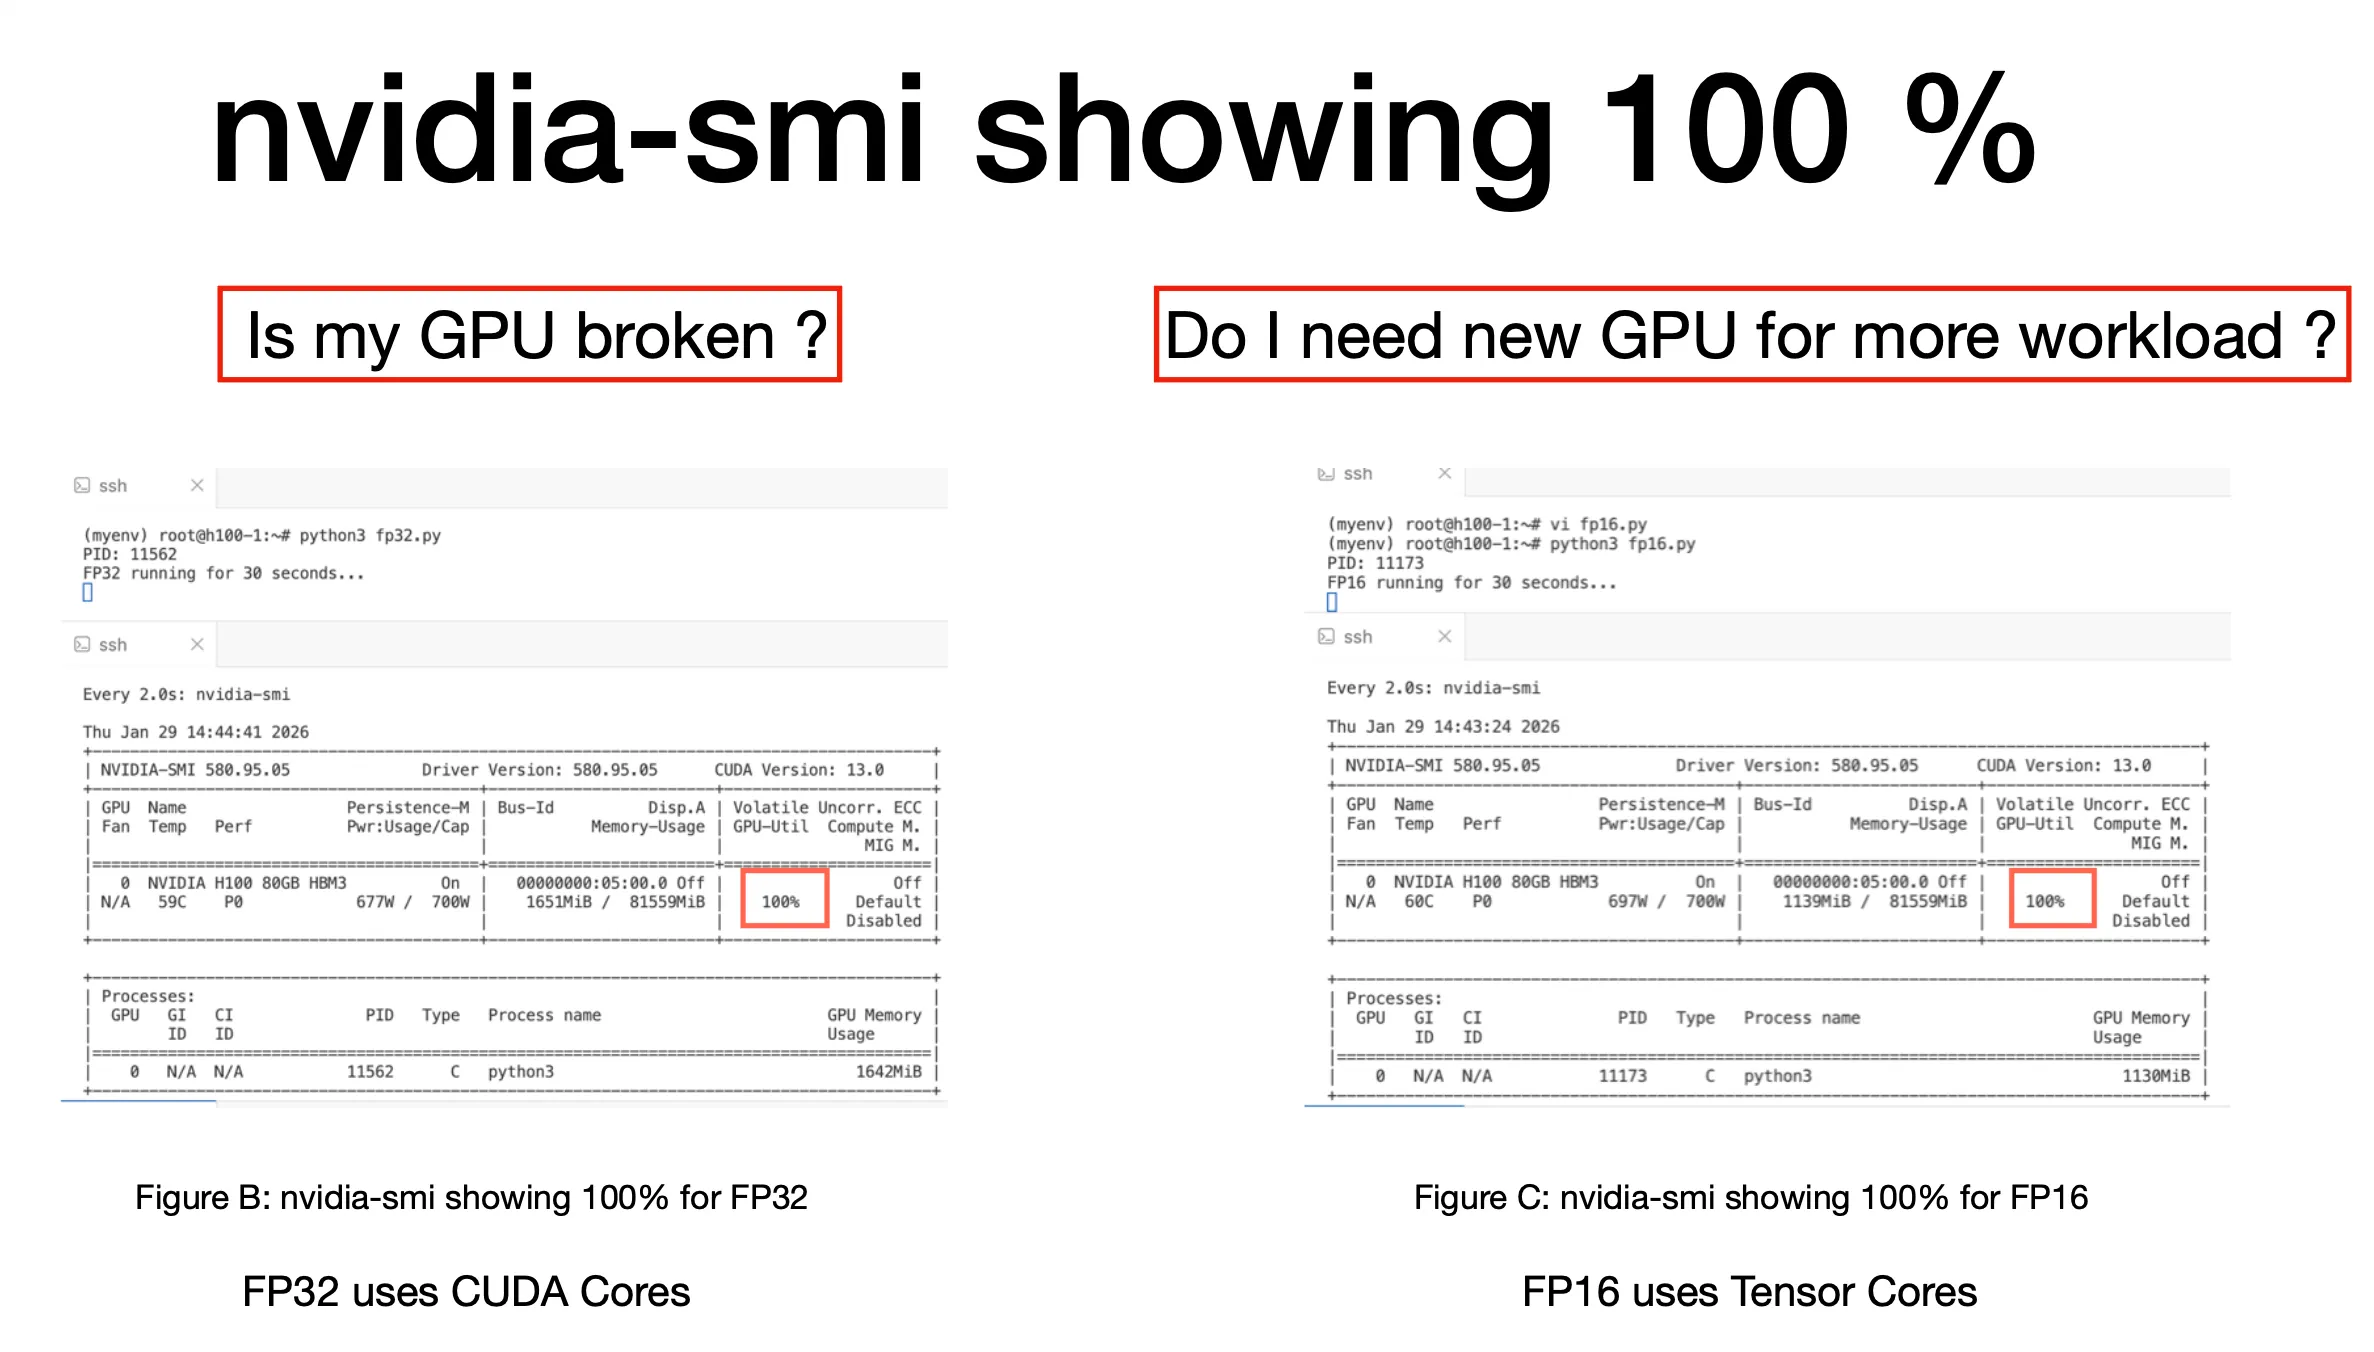 <sub>Figure B & C taken from my FOSDEM 26 talk: Beyond nvidia-smi: Tools for Real GPU Performance Metrics https://fosdem.org/2026/schedule/event/BBYZLU-gpu-performance-monitoring/In the Figure B and C both show 100% GPU-Util for simple FP16 and FP32 matrix multiplication python scripts.</sub>
Both are showing 100% but wait ! What exactly is being used by our GPU ?
2. Not identifying workload relevant metrics to monitor
Identifying what workload is supported by your GPU is essential to speeding up your inference workload.
If you are aware that your GPU supports Tensor Cores and your workload can be modified to utilize these Tensor Cores it can significantly speedup your inference.
Before we get into the details of the identification of relevant metrics to monitor, we first need to understand what is actually being supported by our GPU.
Basic performance specs of the GPU are generally available in the whitepaper by the provider.
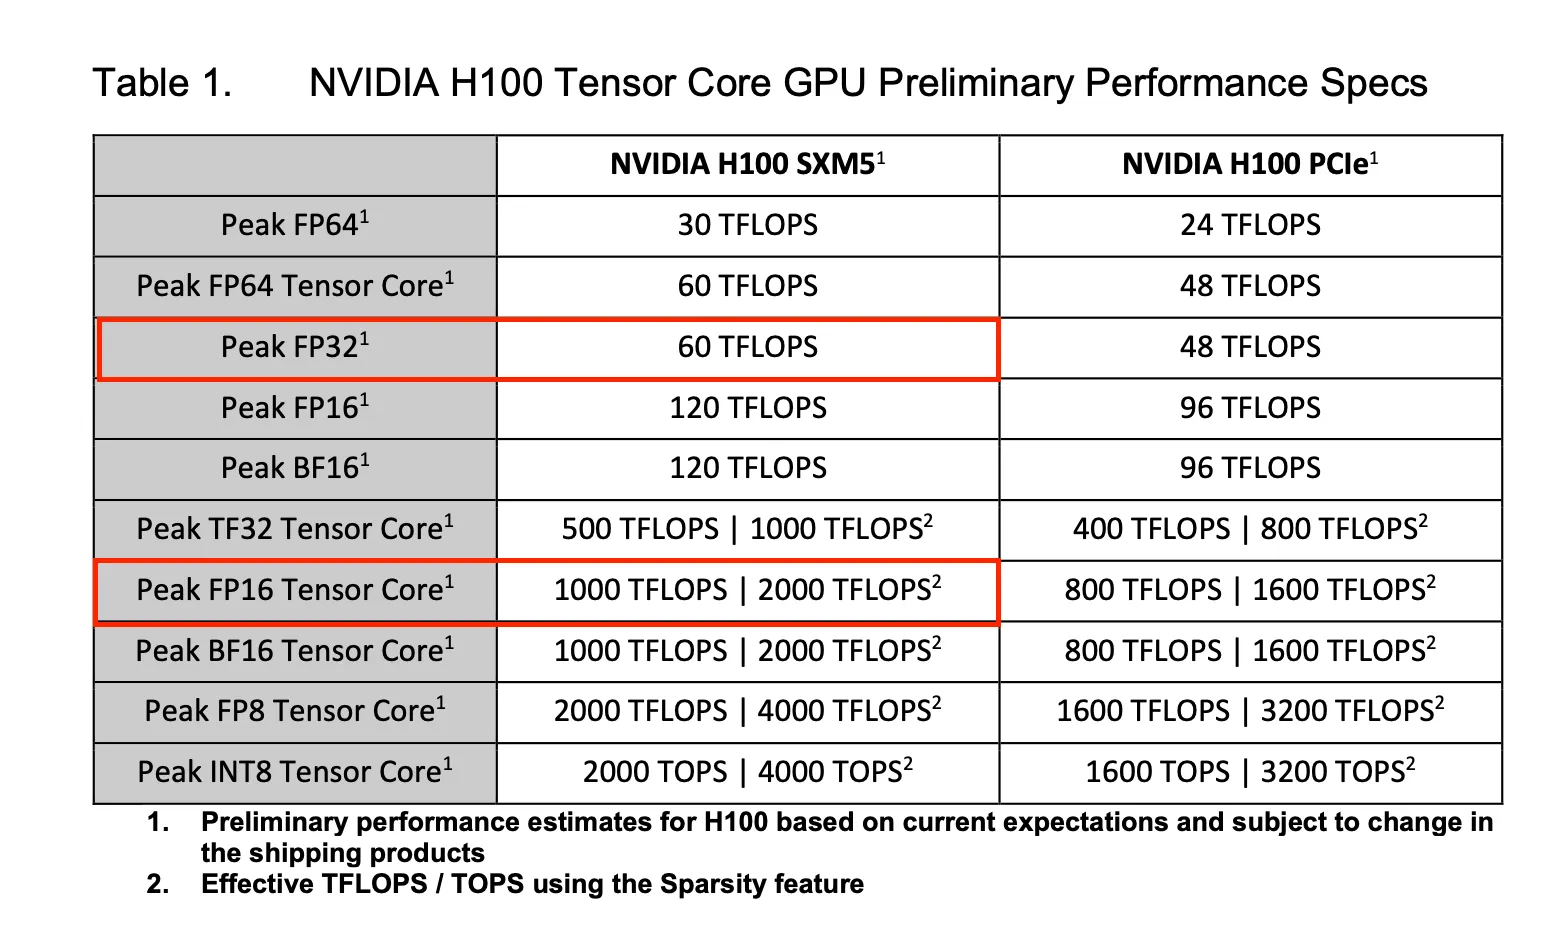 <sub>Table 1 taken from H100 gtc22 whitepaper</sub>
As we can see from Table 1 for our H100, There are two divisions:
- Tensor Cores Performance (Explicitly mentioned as Tensor Core)
- CUDA Cores Performance
Tensor Cores are significantly faster ~8–10x than CUDA Cores.
So ideally whenever possible we should be using Tensor Cores that will significantly improve your inference performance.
In our case we ran FP16 workload that should use Tensor Cores and no CUDA Cores while FP32 should use the CUDA Cores and no Tensor cores.
While nvidia-smi is showing us 100% in both cases we would like to know if our workload is using the Tensor cores or not. nvidia-smi is not able to show us that info, So what option do we have now ?
DCGM is our saviour !
DCGM stands for Data Center GPU Manager it is a suite of utility provided by nvidia for monitoring GPU.
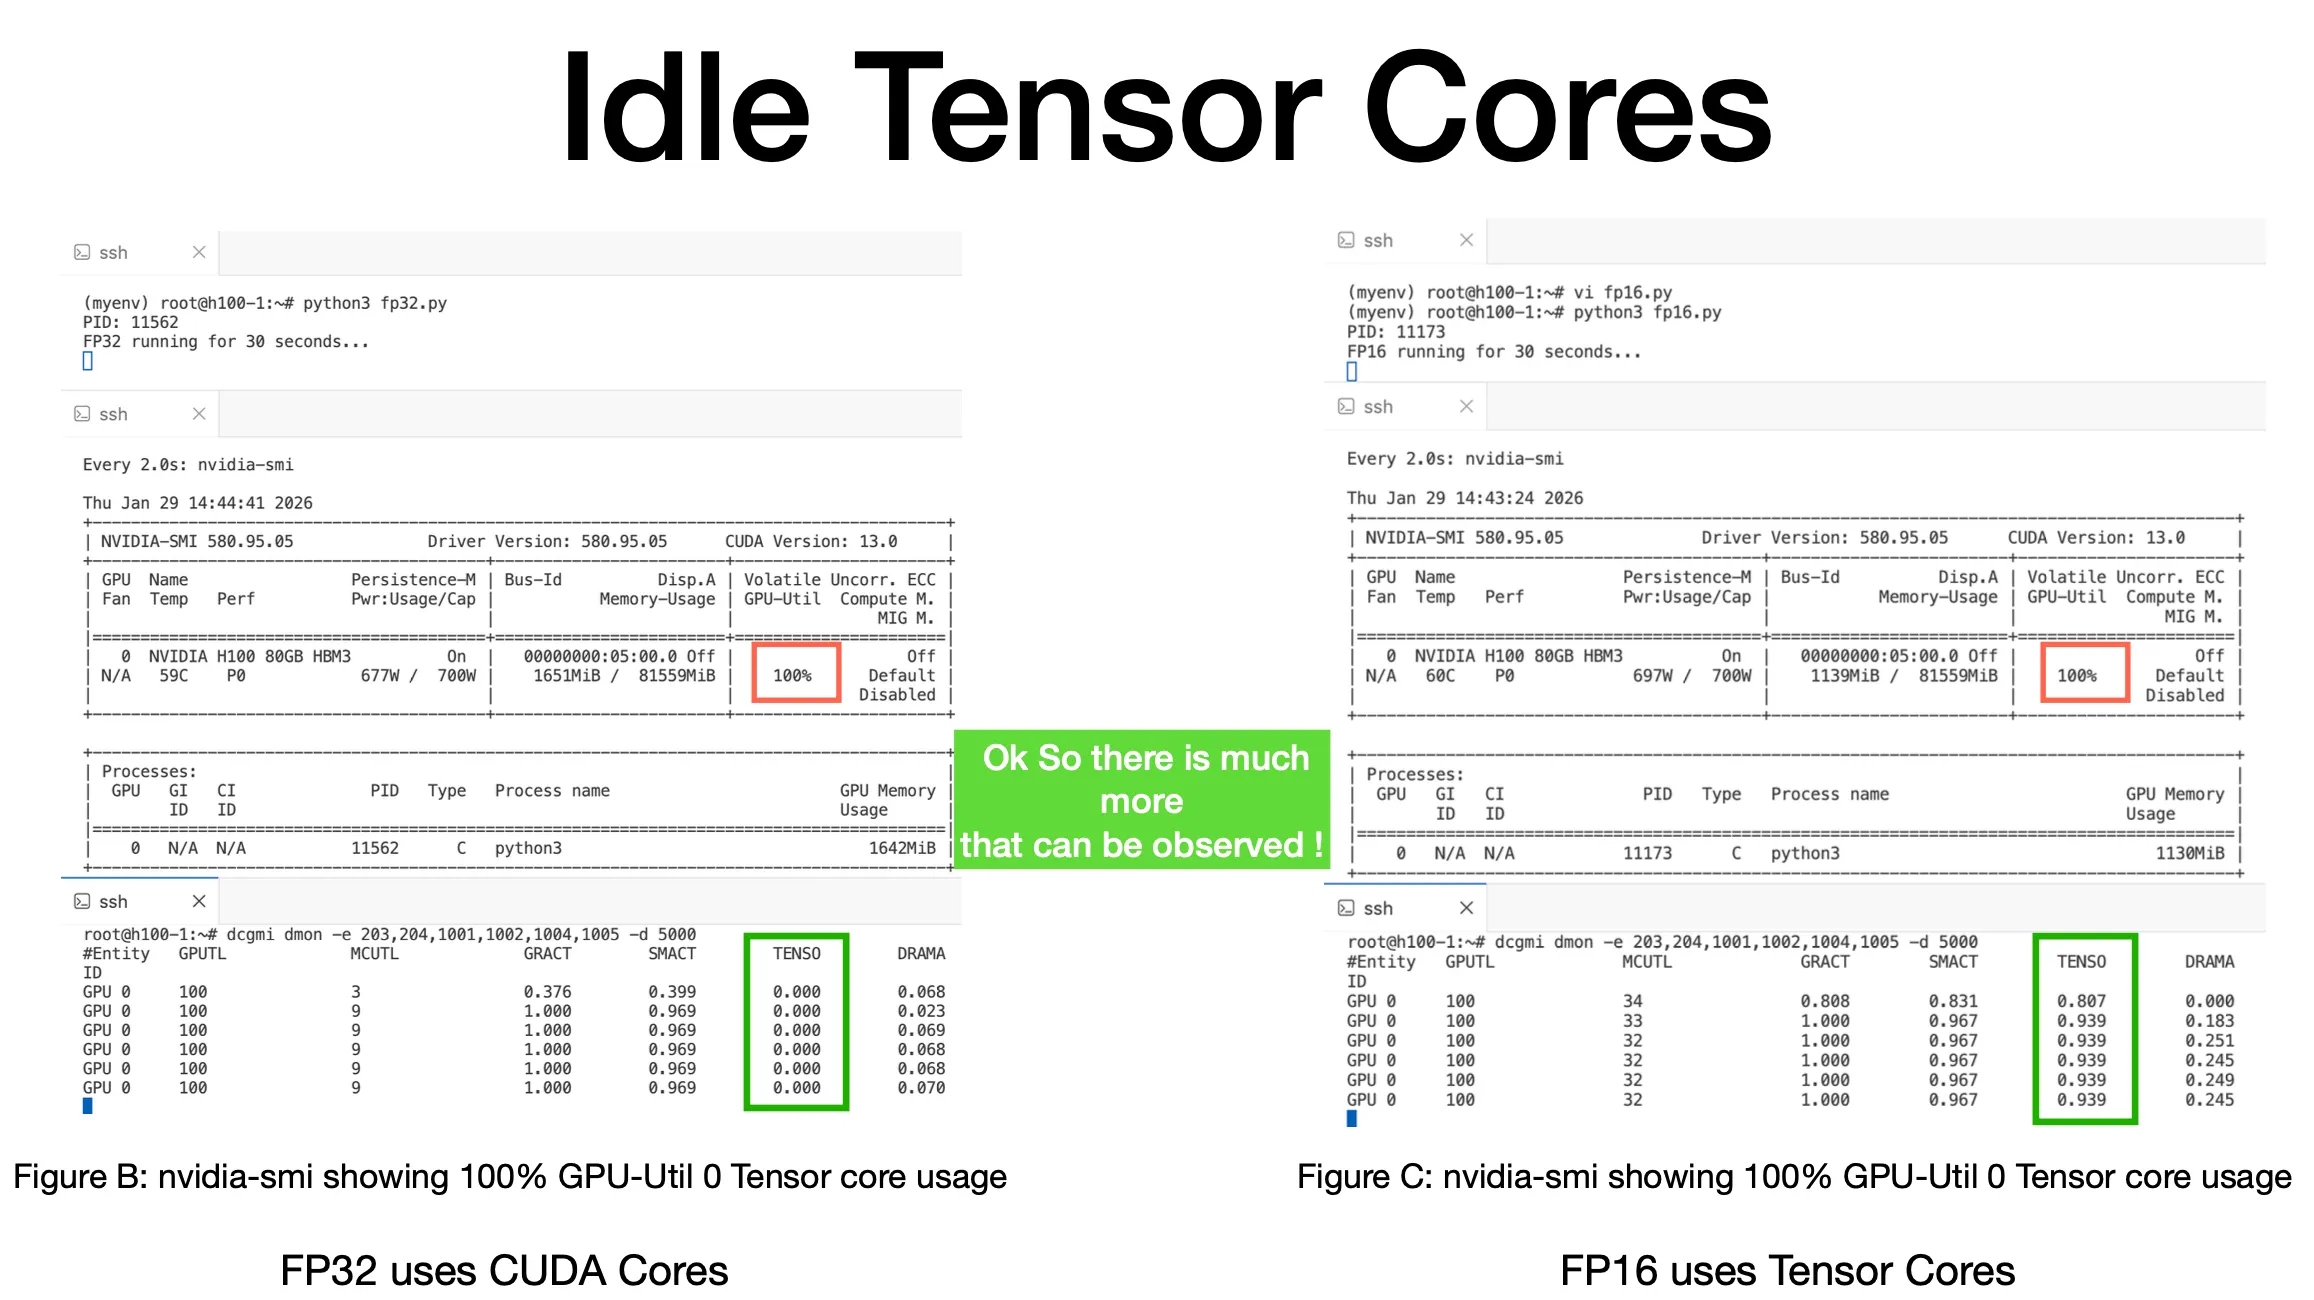 <sub>Figure B & C monitored using DCGM</sub>
We can now see that Tensor Cores are not used in FP32 workload while FP16 is showing Tensor Core usage.
This is what can help us in understanding depth of our workload.
Using nvidia-smi we were not able to monitor if Tensor Cores were used or not. I recently gave a talk at FOSDEM 2026 regarding this: https://fosdem.org/2026/schedule/event/BBYZLU-gpu-performance-monitoring/
Comments
More Blog
View allgemmaFive Gemma-4 models, one accelerator: what porting E2B 31B to AWS Inferentia2 taught me
I ported the whole Gemma-4 family — E2B, E4B, 12B, 31B, and the 26B-A4B MoE — to run on...
X
xbillcommunityHey DEV, I'm Tobore. Let's actually connect.
Hey DEV, I'm Tobore. Let's actually connect. I've been on here for a while now, mostly writing and...
L
Laurina AyarahaiI burned through thousands of AI tokens. Then a friend did it for free
(yep, kinda clickbait, just for the funsies 😊) At the beginning of the year, I relaunched my...
P
Paulo HenriqueaiClaude might be saturating your machine
My laptop was sitting idle with the fan at full tilt. Nothing was running that I knew of. The culprit...
S
Sidhant PandagithubactionsAutomated GitHub Code Reviews Using Google Gemini
I Built a Thing! TL;DR — Google Gemini-based Pull Request reviews and Issue Triaging for...
D
Darren "Dazbo" LesteraiWhat is an "agentic harness," actually?
I've been hearing the word "harness" thrown around a lot lately. I assumed it just meant "the IDE" or...
T
Tilde A. ThuriumReady-made automations for this
Workflows from the Neura Market marketplace related to this DeepSeek resource
- Automate Blog Content Creation with Notion MCP, DeepSeek AI, and WordPressn8n · $9.99 · Related topic
- Generate AI Videos from Scripts with DeepSeek, Synthesia, and Together.ain8n · $24.99 · Related topic
- Compare Multi-Period Financial Data from Google Sheets with DeepSeek AI Analysisn8n · $14.99 · Related topic
- PostgreSQL Conversational Agent with Claude & DeepSeek (Multi-KPI, Secure)n8n · $14.99 · Related topic