PreprintCommunications of the ACM
ImageNet classification with deep convolutional neural networks
Alex Krizhevsky, Ilya Sutskever et al.
130k2017
0
Citations
0
Influential Citations
Neura Market Technical Report NM-TR-2026-01
Venue
2026
Year
Public workflow templates are a written record of what builders think is worth automating. We analyse 26,822 of them — every template we could parse from a corpus of 27,208 collected from n8n.io and Make’s template gallery — by reading each template’s own executable specification rather than its marketing description, and relate that structure to the adoption counter each platform publishes for it. Among n8n templates carrying a genuine publication date, the AI share of newly published templates rose from 0% in 2020 to 58.1% in 2025Q3 (+4.97 percentage points per quarter, R²=0.83). The two platforms have diverged sharply: 48.6% of n8n templates contain an AI step against 7.0% of Make scenarios. Only 1.23% of templates contain an explicit human-approval step, independently corroborating a 2.78% estimate published by Tang, Zhou and Chen (2026) using a different method on a different sample, while 57.3% both run unattended and act on an external system. Adoption is extremely concentrated: the most-adopted 10% of templates account for 75.6% of recorded n8n gallery views and 91.4% of recorded Make usage. Controlling for template age, size and AI use, each additional log-unit of steps multiplies expected views by 1.90 (95% CI 1.77–2.04) while each additional log-unit of distinct connected applications multiplies them by 0.45 (95% CI 0.40–0.50). A published template is an artefact of intent, not evidence of deployment, and a gallery view is interest rather than organisational adoption; the study reports no production-use or purchase data because it holds none. This is an unreviewed technical report: no external researcher reviewed it, and the publisher operates a marketplace listing templates from these corpora.
This report has not been peer reviewed, and no academic institution has been involved in it. It was written by Neura Market, which assembled the corpus and owns the database. It was commissioned by Neura Market and no external researcher reviewed the methodology, the analysis, or these conclusions. It is published as an unreviewed technical report because that is what it is; describing it as a study "with a university" would have been a claim we could not support.
Methodology, code and data dictionary: research/automation-demand-2026/
Public workflow templates are a written record of what builders think is worth automating. We analyse 26,822 of them — every template we could parse from a corpus of 27,208 collected from n8n.io and Make's template gallery — by reading each template's own specification rather than its marketing description, and relate that structure to the adoption counter each platform publishes for it.
Five findings. AI moved from absent to dominant in five years: among n8n templates carrying a genuine publication date, the AI share of newly published templates rose from 0% in 2020 to 58.1% in the third quarter of 2025, a linear trend of +4.97 percentage points per quarter (R²=0.83, p<10⁻⁶). The two platforms have diverged sharply: 48.6% of n8n templates contain an AI step against 7.0% of Make scenarios, a 41.6 point gap. Almost nothing waits for a human: 1.2% of n8n templates contain an explicit approval step, independently corroborating a 2.78% estimate published by Tang, Zhou and Chen (2026) using a different method on a different sample. Adoption is extraordinarily concentrated: the most-adopted 10% of templates account for 75.6% of recorded n8n views and 91.4% of recorded Make usage. And depth attracts while breadth repels: controlling for template age, size and AI use, each additional log-unit of steps multiplies expected views by 1.90 (95% CI 1.77–2.04) while each additional log-unit of distinct connected applications multiplies them by 0.45 (95% CI 0.40–0.50).
We are careful about what this measures. A published template is an artefact of intent, not evidence of deployment. A gallery view is interest, not adoption in any organisation. We hold no data on production use, purchases, or business outcomes, and we say so wherever the distinction matters. What we can show is what builders actually wrote down, at scale, and which of those artefacts the platforms' own users looked at.
Eight findings in plain language. Each links to the section and table that supports it.
AI stopped being a category and became the default. Among dated n8n templates, AI's share
of new publications went from zero in 2020 to 58.1% by 2025Q3 (§5,
t16). This is the single largest change in the corpus.
n8n and Make are not doing the same thing. 48.6% of n8n templates call a model; 7.0% of Make
scenarios do. n8n templates have a median of 8 executable steps to Make's 2
(§4, t02, t04).
Human approval is close to nonexistent. 1.23% of n8n templates contain an explicit
approval step; 0% of Make scenarios have one available to detect
(§6, t06).
Most templates are built to act, not to look. 57% of parseable templates both run
unattended and write data or send a message (§6, t08).
Attention is captured by a handful of templates. The top 10% take 75.6% of n8n views and
91.4% of Make usage; 38.1% of Make scenarios record no usage at all
(§7, t13).
Complexity attracts attention; fragmentation repels it. More steps predicts more views;
more distinct connected apps predicts fewer, holding age and size constant
(§8, t12).
The corpus runs on a dozen general-purpose tools. 1,436 distinct applications appear, but
Google Sheets alone is in 22.1% of templates and the top ten take 40% of all application
mentions (Gini 0.79) (§3, t09).
The categories builders publish most are not the ones that get used most. On Make,
content and social templates earn roughly three times the adoption share of their supply share,
while support, IT and HR templates earn under a seventh
(§9, t14).
There are three ways to find out what people automate, and each is compromised differently.
Surveys ask people what they intend to do. They capture aspiration and are subject to every familiar reporting bias.
Vendor telemetry observes real execution but only inside one company's customer base, and it is published selectively. Zapier's AI Workflow Index is the best current example and is admirably explicit about its own bounds: it studies the top quartile of 1,500 sampled companies by AI adoption, and states outright that it is "not a picture of average AI adoption" (Zapier, Q2 2026). The underlying data is not available to anyone else.
Published artefacts — the option taken here — are what builders committed to, in a formal specification, and chose to make public. A template is not a deployment. But it is not a stated intention either: someone constructed a working graph, wired real applications together, and published it. It sits between what people say and what organisations run.
The specific gap this report fills: no prior source we could find measures the share of automation that uses AI, because prior work filters to AI-containing workflows before counting. Tang, Zhou and Chen (2026) analysed 6,003 n8n workflows but selected them on the presence of an LLM component, so their denominator is AI by construction. Zapier's index likewise studies AI-enabled workflows within selected accounts. Neither can answer "what fraction of automation is AI, and how has that changed?" — because neither has non-AI automation in the denominator. We do.
Full detail in methodology.md; the essentials follow.
We read each template's own specification — the JSON graph that the platform executes — and not the marketing text attached to it in the cross-platform workflow template collection these templates are listed in. This matters more than it sounds. The descriptive text in our database has largely been rewritten by us: comparing against a pre-rewrite backup, current titles match the original on 17.4% of rows and descriptions on 7.6%, with mean description length cut from 1,047 to 376 characters. Classifying that text would have measured our own copywriting. The graph is the creator's actual work, and it was never rewritten.
n8n stores templates in two shapes: a bare specification, and an API-response envelope whose own
nodes array is a node-type catalogue rather than the graph, with the real graph one level
deeper. Reading the catalogue as a graph yields zero usable steps. Our first pass made exactly
this mistake and reported 57% of n8n templates as unparseable; handling both shapes lifts that to
98.2%. Make scenarios nest child flows inside router routes and are walked recursively.
Two exclusions materially affect counts. n8n stickyNote nodes are canvas documentation, not
steps — and they are the single most common node type in the corpus at 30,177 instances. n8n
LangChain sub-nodes (a chat model, a memory buffer, an output parser) configure an orchestrator
rather than executing independently; counting them as steps would roughly triple apparent AI
depth. Both are excluded from every count.
Result: 26,822 of 27,208 templates parse (98.6%).
All classification is deterministic rules over the graph. No model is in the loop, so the pipeline is exactly reproducible.
Validation uses an external reference standard: the 5,345 n8n templates stored in the API-envelope shape carry n8n.io's own category labels, assigned on n8n's side with no knowledge of this study. Rules were tuned on a 40% development split and scored on the untouched 60% held-out split, assigned by a hash of the template id so it cannot be reshuffled.
| Classifier | Precision | Recall | F1 | Cohen's κ | Verdict |
|---|---|---|---|---|---|
| AI present | 0.989 | 0.721 | 0.834 | 0.613 | Reported |
| Retrieval-augmented | 0.644 | 0.381 | 0.478 | — | Not reported at class level |
| Business function (macro) | — | — | 0.496 | — | Reported for 4 of 9 classes only |
Two consequences we accept rather than work around.
RAG detection fails. F1 0.478 is not good enough, so no class-level claim about retrieval-augmented workflows appears in this report.
Business-function classification is only partly usable. Our first attempt classified function from connected applications alone and scored held-out macro-F1 0.193 — a failure, because it answered a different question ("which domain-specific system does this integrate?") than the one asked ("what is this for?"). Rebuilt as a text-plus-applications hybrid it reaches 0.496. Under the reliability threshold set before results were inspected (held-out F1 ≥ 0.50), only four classes qualify: HR/recruiting (0.692), sales/CRM (0.686), finance/accounting (0.571) and content/media (0.508). Marketing (0.358), social media (0.373), IT/DevOps (0.376), support (0.426) and project management (0.471) do not, and every function-level statement in Section 9 is flagged accordingly.
Precision here is a lower bound: n8n assigns few labels per template, so a correct prediction the reference standard simply did not record is scored as a false positive.
Auditing the corpus before analysis found that several fields which look like observed data are
not. They are excluded entirely, and the basis for each is recorded in
data/provenance-ledger.csv:
Math.random().The last point is why this report is not about demand. We have no purchase data worth the name, and we do not pretend otherwise.
Adoption counts are heavily overdispersed (n8n views: mean 4,742, median 667), so Poisson models
are inappropriate and negative-binomial (NB2) models are fitted by maximum likelihood. statsmodels
was unavailable, so the estimator is implemented directly in analyse.py; it passes a recovery
self-test on simulated data with known coefficients before any real model is fitted (max
coefficient error 0.022; α recovered as 0.834 against a true 0.80), and the script refuses to run
if that test fails.
n8n views and Make usage are never pooled. They are different platforms' counters, on different scales, measuring different acts. Every adoption model is fitted per platform.
Where families of comparisons are run, p-values carry Benjamini–Hochberg correction. Effect sizes and confidence intervals are reported throughout. Nothing here is causal: template selection into a public gallery is not random, and gallery placement and platform promotion are unobservable to us and remain uncontrolled confounds.
| Platform | Templates | % of corpus | Parseable |
|---|---|---|---|
| Make | 13,660 | 50.2% | 99.7% |
| n8n | 13,126 | 48.2% | 98.2% |
| Zapier | 334 | 1.2% | 74.9% |
| Activepieces | 65 | 0.2% | 100% |
| Pipedream | 23 | 0.1% | 0% |
Make and n8n are 98.5% of the corpus. Zapier, Activepieces and Pipedream are too small to support comparison and are excluded from every platform contrast in this report. We report them here only as an honest statement of coverage. Pipedream contributes no parseable graph at all.
Recomputing a content hash from every specification — the stored hash covered only 58% of rows — finds 304 duplicate groups involving 619 templates (2.3%). Duplication is real but minor.
Applications. 1,436 distinct applications appear across the corpus, and the distribution is severely concentrated (Gini 0.79). Google Sheets appears in 22.1% of all parseable templates. The top ten applications account for 40% of all application mentions.
| Application | Templates | % of parseable |
|---|---|---|
| Google Sheets | 5,924 | 22.1% |
| Gmail | 2,554 | 9.5% |
| Slack | 2,135 | 8.0% |
| Telegram | 2,033 | 7.6% |
| Google Drive | 1,861 | 6.9% |
| Airtable | 1,353 | 5.0% |
| Generic email | 1,094 | 4.1% |
The commonest pairing in the entire corpus is Gmail with Google Sheets (823 templates), followed by Google Drive with Google Sheets (630) and Google Sheets with Slack (411). Readers wanting the application-level view rather than the workflow-level one may find the wider AI tool and application ecosystem the more useful lens. The modal automation template moves data between a spreadsheet, an inbox and a chat channel. Every much-discussed category — CRM, e-commerce, DevOps — sits well below this.
The clearest structural result in the corpus is that n8n and Make templates are not the same kind of object.
| Measure | n8n (n=12,892) | Make (n=13,615) |
|---|---|---|
| Median executable steps | 8 | 2 |
| Mean steps | 11.5 | 3.0 |
| 95th percentile steps | 30 | 6 |
| Largest template | 199 steps | 53 steps |
| Contains branching | 43.6% | 6.5% |
| Contains a loop | 22.1% | 6.0% |
| Uses raw HTTP | 57.1% | 8.9% |
| Median distinct apps | 1 | 2 |
The step-count difference is large and not an artefact of skew (Mann–Whitney p < 10⁻³⁰⁰, rank-biserial −0.80 — an effect size at which roughly 90% of randomly paired templates favour n8n).
The direction of the app-count comparison is worth pausing on: n8n templates are four times larger but connect fewer distinct applications (median 1 versus 2). n8n templates are deep and narrow — many steps against one or two systems, with 57.1% reaching something over raw HTTP rather than a packaged integration. Make scenarios are shallow and wide: two or three steps joining two named applications.
For a practical rather than structural account of how the two platforms differ in day-to-day use, and of what moving a workflow between them involves, see the resources listed at the end of this report.
That difference is best read as populations, not products. n8n is self-hostable and developer-oriented; Make is a commercial no-code tool. The templates each community publishes look like the community, and we cannot separate platform capability from creator population with this data.
Among the 5,345 n8n templates carrying a genuine source publication date, the share of newly published templates containing an AI step rose from 0% in 2020Q2 to 58.1% in 2025Q3. The linear trend is +4.97 percentage points per quarter (R²=0.83, p=9.0×10⁻⁷).
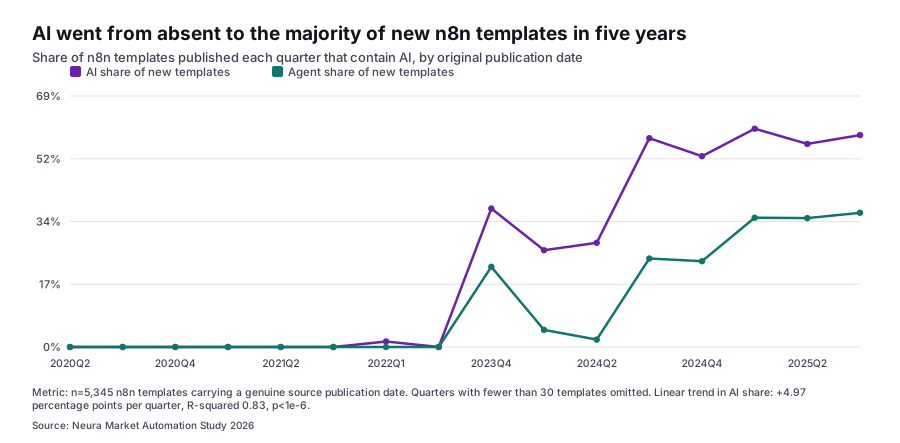
The agent share — templates containing a tool-using agent rather than a single model call — follows about a year behind and reaches 36% of new templates by 2025Q3. Two step-changes are visible: one in 2023Q4, and a larger one through 2024Q3–Q4.
This is the finding that a corpus filtered to AI workflows cannot produce. Because our denominator includes non-AI automation, AI share is an outcome rather than an inclusion criterion.
Two caveats bound it. The dated sub-corpus is n8n-only, and it is the templates n8n surfaced through its API — not a random sample of everything ever published. And publication date is when the template was published, not when it was built.
| Platform | Templates | Contains AI | 95% CI | Contains an agent |
|---|---|---|---|---|
| n8n | 12,892 | 48.6% | 47.8–49.5% | 29.4% |
| Make | 13,615 | 7.0% | 6.6–7.5% | 0.8% |
A 41.6 point gap (z=76.0, p<10⁻¹⁵). Among n8n templates that use AI, 60.4% contain an agent — AI in this corpus is not predominantly a single summarisation call bolted onto a pipeline; on n8n it is more often an agent with tools. Neura Market maintains a separate agent catalogue for readers tracking that shift at the agent level rather than the template level.
Part of this gap is measurement. Make's blueprint format exposes less structure than n8n's, and Make templates calling a model through a generic HTTP module are harder to detect. Our AI classifier has recall 0.721 against n8n's own labels, so the n8n figure is if anything an undercount, and we have no equivalent reference standard for Make. The gap is large enough that measurement error is unlikely to explain it, but the Make figure is the less certain of the two.
| Autonomy | n8n | Make |
|---|---|---|
| Unattended (schedule, webhook, app event, inbound email) | 55.8% | 93.4% |
| Human-initiated (manual, form, chat) | 34.8% | — |
| Explicit approval step | 1.23% | 0% |
| Undetermined | 8.3% | 6.6% |
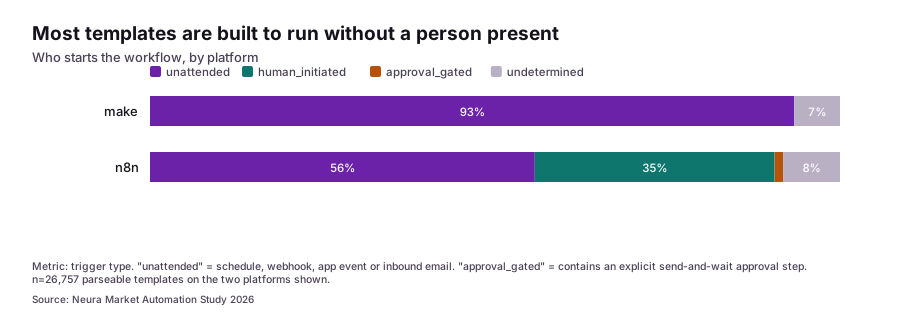
Crossing autonomy with what the template can do to the outside world: 57.3% of all parseable templates both run unattended and either write data or send a message to someone. That is the modal automation artefact in this corpus — something that starts on its own and changes something outside itself.
Tang, Zhou and Chen (2026) analysed 6,003 LLM-containing n8n workflows and found 2.78% (167) contained a human-mediated path before an external action. On the comparable subset here — the 6,268 n8n templates containing AI — we find 2.23% carry an explicit approval step.
Two different methods (their LLM-assisted annotation; our deterministic detection of sendAndWait
operations), two different corpus snapshots, the same conclusion within a percentage point:
explicit human approval sits at roughly 2–3% of AI automation templates. Independent
corroboration is worth more than either estimate alone, and we report it as such.
We diverge from them on error handling: they report 30.5%, we find 20.8% among n8n AI templates. The likely cause is definitional — their error-handling anchors include "always output data" (29.3% of their anchors), which we do not count. Ours should be read as the stricter measure.
A limitation that must not be misread as a finding: Make error handling is 0.0% because Make's exported blueprint contains no per-module error field. It is unobservable, not absent. Any comparison of error handling across these two platforms is invalid, and we do not make one.
| Action level | n8n | Make |
|---|---|---|
| Communicates with a person | 36.0% | 29.6% |
| Writes data | 19.7% | 52.2% |
| Read-only | 6.4% | 9.4% |
| Consequential (delete, pay, publish, deploy) | 3.5% | 3.2% |
| No external action | 16.5% | 1.3% |
| Undetermined | 18.0% | 4.4% |
Consequential actions — the irreversible ones — sit at 3.5% and 3.2%. Combined with the approval finding, that is the governance-relevant result: a small but real population of templates takes hard-to-reverse actions unattended, and essentially none of them pause for a human.
The "undetermined" rows are honest bookkeeping. n8n nodes frequently default their operation rather than declaring it, so 18% of n8n templates reach a third-party app without stating what they do to it. Our first version of this ladder silently scored those as read-only, which understated write and communicate behaviour; treating them as unknown is the correct handling. Read this table as a floor.
| n8n views | Make usage | |
|---|---|---|
| Templates with a known counter | 5,345 | 13,615 |
| Recording zero | 1.5% | 38.1% |
| Median | 667 | 3 |
| 99th percentile | 69,915 | 1,483 |
| Maximum | 938,984 | 83,089 |
| Share taken by the top 1% | 32.7% | 61.2% |
| Share taken by the top 10% | 75.6% | 91.4% |
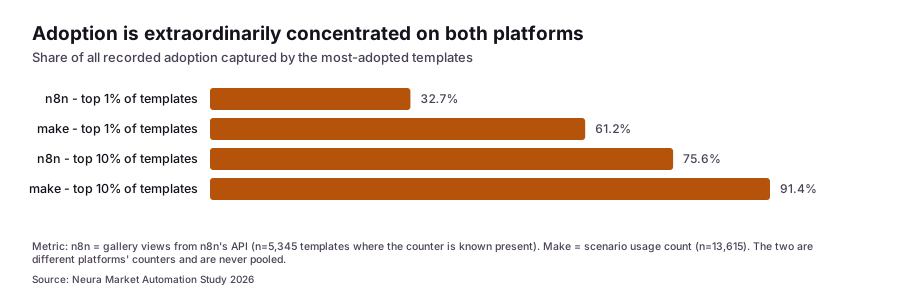
Both distributions are extreme, and Make's is more extreme than n8n's: 61% of all recorded Make usage goes to the top 1% of scenarios, and 38% of scenarios record no usage at all.
A methodological note that changed this result. n8n view counts live in two different places depending on how the template was captured, and the two are exactly complementary: envelope rows carry n8n's counter inside the payload while the column we would naturally read is zero for 99.4% of them. Reading that column alone would have coded "not captured" as "zero adoption" for 5,314 templates and produced a false headline that 61% of n8n templates have never been viewed. The analysis is therefore restricted to the sub-corpus where the counter is known present.
Make's zeros carry a residual ambiguity we cannot resolve — a 0 may be a genuine zero or a field
the scraper never saw — so a positives-only sensitivity model is reported alongside the primary
one in t11.
Negative-binomial model of n8n gallery views on the dated sub-corpus (n=5,345), controlling for template age:
| Term | Rate ratio | 95% CI | p |
|---|---|---|---|
| Template age (log days) | 9.66 | 8.83–10.57 | <10⁻¹⁵ |
| Contains AI | 4.50 | 4.11–4.92 | <10⁻¹⁵ |
| Steps (log) | 1.90 | 1.77–2.04 | <10⁻¹⁵ |
| Acts externally | 1.49 | 1.34–1.66 | 2×10⁻¹³ |
| Runs unattended | 0.79 | 0.72–0.87 | 4×10⁻⁷ |
| Distinct apps (log) | 0.45 | 0.40–0.50 | <10⁻¹⁵ |
Age dominates, as it must — a counter that only accumulates rewards old templates, and a model that failed to show this would be broken.
Beyond age, two results stand out and point in opposite directions. Size attracts attention (RR 1.90 per log-step) while spreading across more applications repels it (RR 0.45 per log-app). Holding template size constant, a template touching more distinct systems draws less attention than one of the same size concentrated on fewer.
That is not the intuition the integration-count marketing of every automation platform would predict. A plausible reading — which this data cannot confirm — is setup cost: each additional application is another account, another credential, another permission scope before the template runs at all. Depth is free to the reader; breadth is billed to them.
AI's 4.5× is the largest non-age effect in the model, and it survives controls for size, app count, autonomy and external action. The same sign holds in the Make model (RR 2.76) and in unmodelled medians (Make: median usage 7 for AI templates against 3 overall, BH-significant).
Templates that run unattended draw fewer views (RR 0.79). We would not over-read this; browsing a gallery is not the same act as adopting a workflow, and a human-initiated template may simply be easier to evaluate by looking at it.
These are associations, not effects. Templates are not randomly assigned their features, and gallery placement — which we cannot observe — plausibly drives both structure and views.
This section uses the business-function classifier. Only four of its nine classes met the pre-set reliability threshold (held-out F1 ≥ 0.50): HR/recruiting, sales/CRM, finance/accounting and content/media. Figures for other classes are shown for completeness and marked ⚠; they should not be quoted as findings.
Make (n=13,615), ratio of adoption share to supply share — above 1.0 means a category earns more attention than its share of published templates:
| Function | Templates | Supply share | Adoption share | Ratio |
|---|---|---|---|---|
| Content & media | 184 | 1.4% | 4.3% | 3.19 |
| Social media ⚠ | 382 | 2.8% | 8.4% | 3.00 |
| Marketing ⚠ | 661 | 4.9% | 8.9% | 1.83 |
| General automation | 8,611 | 63.3% | 65.3% | 1.03 |
| E-commerce ⚠ | 777 | 5.7% | 4.1% | 0.72 |
| Project management ⚠ | 1,061 | 7.8% | 4.1% | 0.53 |
| Finance & accounting | 347 | 2.6% | 1.1% | 0.43 |
| Sales & CRM | 833 | 6.1% | 2.0% | 0.33 |
| IT & DevOps ⚠ | 161 | 1.2% | 0.2% | 0.13 |
| Support ⚠ | 206 | 1.5% | 0.2% | 0.12 |
| HR & recruiting | 77 | 0.6% | 0.1% | 0.11 |
Restricting to the four reliable classes only: content and media templates earn 3.2× their supply share of adoption, while sales/CRM earns 0.33×, finance 0.43× and HR 0.11×.
The honest reading is narrower than "the market wants content automation". Content templates on Make have a median usage of 22 against a corpus median of 3 — they are genuinely more used. But a CRM template is used by whoever runs that CRM, while a content template can be picked up by anyone; a gallery counter rewards generality, and that is a property of the measure as much as of demand. What we can say without qualification is that the categories builders publish most are not the categories that get used most, and the mismatch is large.
The same pattern holds on n8n with a different ordering (content 1.37, social 1.54, personal productivity 1.73 against IT/DevOps 0.49 and project management 0.43), which is at least suggestive that it is not a Make artefact.
For the 5,345 n8n templates with recoverable authorship: 1,182 distinct creators, median 2 templates each, Gini 0.643. The top creator accounts for 5.1% of templates, the top ten for 22.5%, the top fifty for 43.4%. Concentrated, but far less so than adoption — publishing is much more evenly spread than attention.
For businesses. The corpus is not evidence that these automations work. It is evidence of what experienced builders thought was worth writing down. The most useful signal here is negative: if your intended automation is in a category with high supply and low adoption — CRM, support, IT ticketing — abundant templates are not evidence that the approach succeeds. Whether a specific automation is worth building is a question about your own volumes and error rates, not about how many templates exist; an automation ROI calculator is a more honest starting point than a template count.
For builders. Two results are directly actionable and neither is obvious. Depth beats breadth: a substantial workflow against one or two systems draws more attention than a shallow one spanning five. And the AI association is large (4.5×) and has grown every quarter for three years.
For platforms. 57% of templates run unattended and act externally, while 1.2% pause for a
human. If human-in-the-loop is a governance goal, the primitives are not being used —
n8n's sendAndWait exists and appears in 189 node instances across a corpus of 222,276 nodes. That
is a product finding, not a user failing: the default path does not lead through it.
For researchers. The corroboration in §6 is the useful part. Two methods, two samples, one answer on human oversight. The disagreement on error handling shows how much definitional choices move these numbers, which is an argument for publishing rule sets rather than percentages.
For Neura Market. Section 9 says the categories with most published supply are not the ones that get used. Our own marketplace lists templates from these corpora, and this finding is unhelpful to it. We are publishing it because it is what the data shows.
Prominent because they are load-bearing.
Everything needed to reproduce this is in research/automation-demand-2026/:
| Artefact | Path |
|---|---|
| Feature extraction rules | scripts/lib/graph-features.mjs |
| Function classifier | scripts/lib/function-classifier.mjs |
| Pipeline | scripts/build-features.mjs |
| Validation | scripts/validate-classifier.mjs → validation/ |
| Analysis + NB estimator | scripts/analyse.py → tables/ |
| Charts | scripts/make-charts.py → charts/ |
| Frozen snapshot | data/snapshot-manifest.json |
| Field provenance verdicts | data/provenance-ledger.csv |
| Pre-analysis data audit | data-feasibility-report.md |
The snapshot manifest records exact counts, inclusion and exclusion rules, code hashes and software versions. Aggregate tables are published; the template corpus is not, for the licence reason given in the disclosure.
Three figures appear inline in the analysis above (Figures 1-3). The remaining five are reproduced here so the web version carries the same evidence as the PDF and DOCX editions, rather than a subset of it.
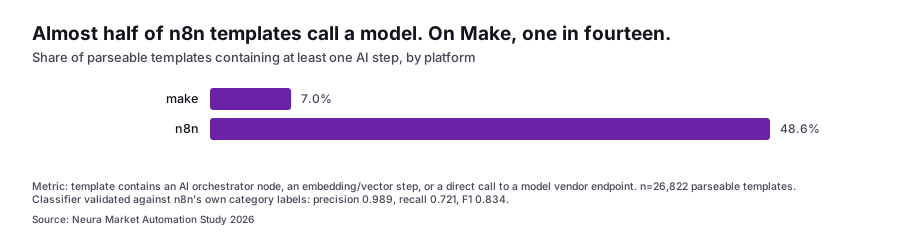
Figure 4. Share of templates containing at least one AI step, by platform.
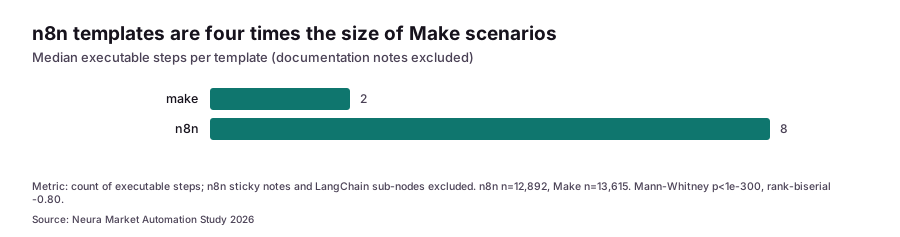
Figure 5. Median executable steps per template, by platform.
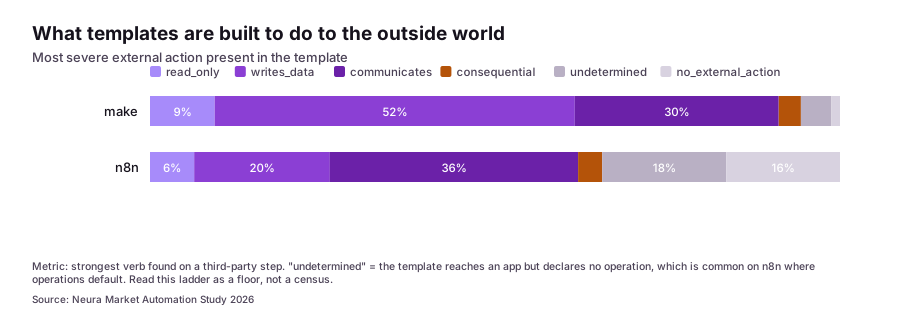
Figure 6. Most severe external action present in the template.
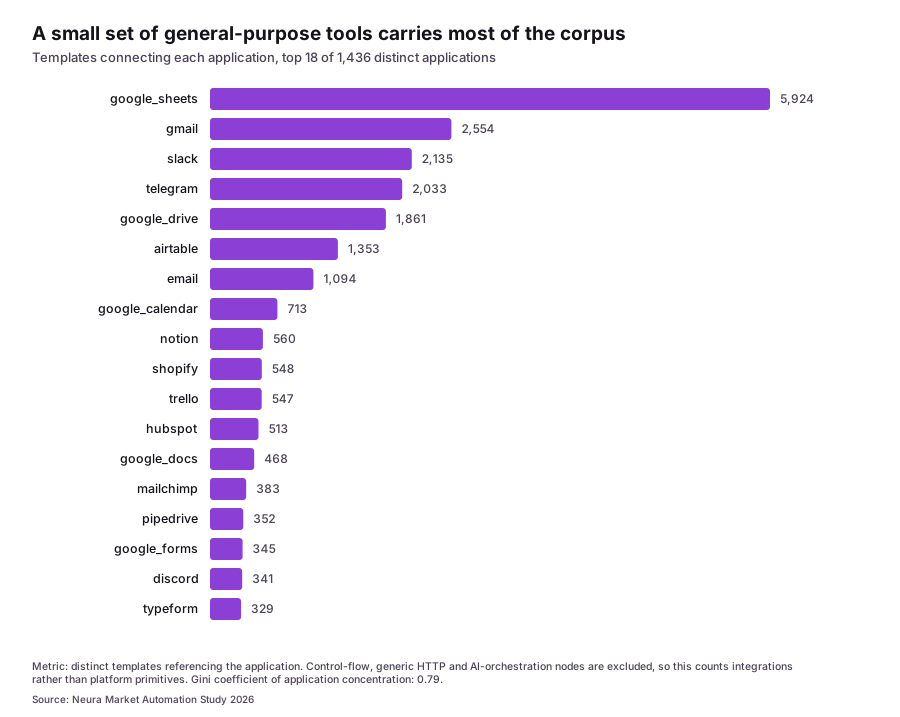
Figure 7. Templates connecting each application (top 18 of 1,436).
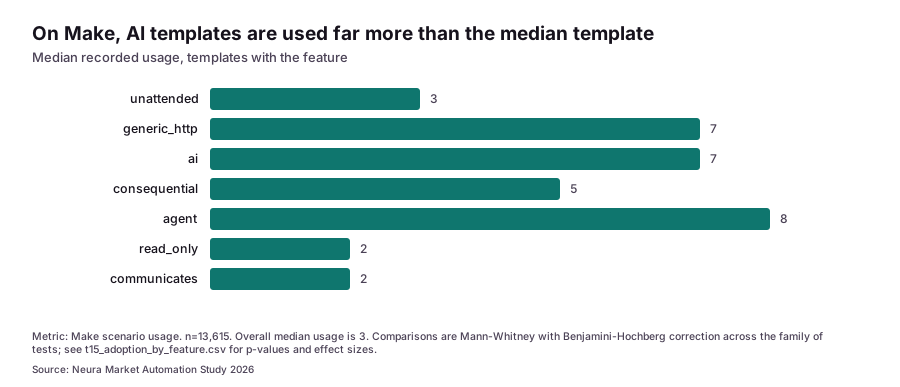
Figure 8. Median recorded Make usage, templates with each feature.
Listed separately rather than woven into the findings, because they are context for a reader, not evidence for a claim. Neura Market published this report; see the disclosure above.
Sources were opened and read; see literature-review.md for extraction
notes and the basis of the novelty claim.
Neura Market (2026). What Builders Publish, and What Gets Used: A structural analysis of 26,822 workflow-automation templates from n8n and Make. Neura Market Technical Report NM-TR-2026-01.
BibTeX and plain-text forms: citation-guide.md.
Corrections policy: corrections-policy.md.
Alex Krizhevsky, Ilya Sutskever et al.
Ashish Vaswani, Noam Shazeer et al.
Douglas M. Bates, Martin Mächler et al.
Diederik P. Kingma, Jimmy Ba