
Back to Blog gemma4
 ai
ai googlecloud
 discuss
 agents
 agenticarchitect
 ai
ai
Debugging Deployments with Gemma 2B, TPU v6e-4, MCP, and Antigravity CLI
xbill July 3, 2026
0 views
This article provides a step by step debugging guide for deploying Gemma 4 to a Google Cloud TPU...
title: Debugging Deployments with Gemma 2B, TPU v6e-4, MCP, and Antigravity CLI published: true series: Gemma4 date: 2026-07-03 02:55:09 UTC tags: gemma4,python,tpu,mcps canonical_url: https://xbill999.medium.com/debugging-deployments-with-gemma-2b-tpu-v6e-4-mcp-and-antigravity-cli-104237d407ad
This article provides a step by step debugging guide for deploying Gemma 4 to a Google Cloud TPU system,. A suite of Python MCP tools is built to simplify management of the vLLM hosted Gemma 4 deployment with Antigravity CLI.

What is this project trying to Do?
This project is a DevOps/SRE assistant that uses a Gemma 4 model hosted on TPU. It provides tools to provision the Docker container and deploy the model, as well as for observability and performance testing.
This project is similar to a previous project that targeted GPU hosted Gemma4 instances on GCP:
Gemma-SRE: Self-Hosted vLLM Infrastructure Agent
Antigravity CLI
Antigravity CLI is the follow-on successor to Gemini CLI- the terminal driven, agent assisted coding tool.
Full details on installing Antigravity CLI are here:
Getting Started with Antigravity CLI
Testing the Antigravity CLI Environment
Once you have all the tools in place- you can test the startup of Antigravity CLI.
You will need to authenticate with a Google Cloud Project or your Google Account:
agy
This will start the interface:
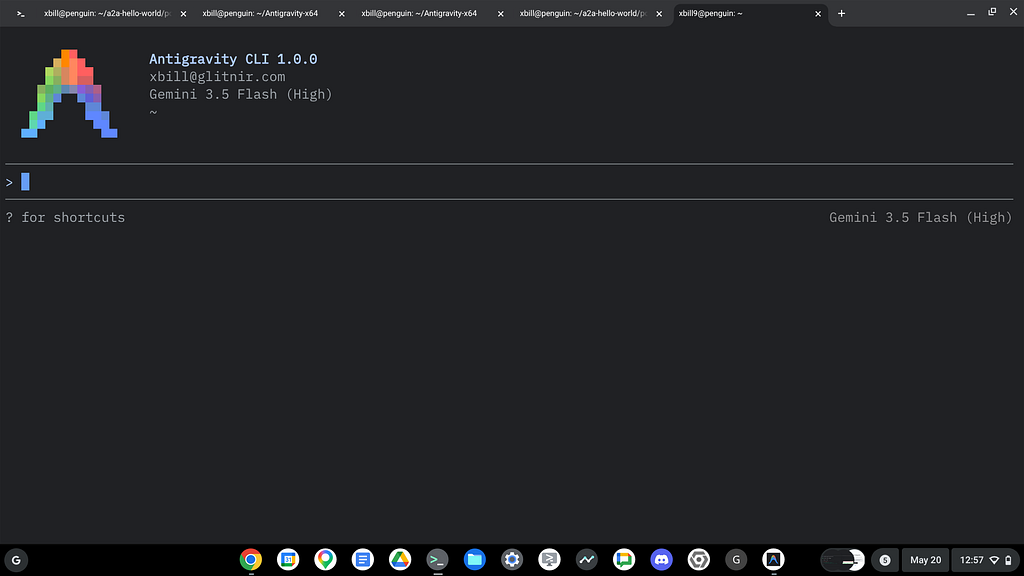
Full Installation Instructions
The detailed installation instructions for Antigravity CLI are here:
Getting Started with Antigravity CLI
Python MCP Documentation
The official GitHub Repo provides samples and documentation for getting started:
Where do I start?
The strategy for starting MCP development for model management is a incremental step by step approach.
First, the basic development environment is setup with the required system variables, and a working Antigravity CLI configuration.
Then, a minimal Python MCP Server is built with stdio transport. This server is validated with Antigravity CLI in the local environment.
This setup validates the connection from Antigravity CLI to the local server via MCP. The MCP client (Antigravity CLI) and the Python MCP server both run in the same local environment.
Setup the Basic Environment
At this point you should have a working Python environment and a working Antigravity CLI installation. The next step is to clone the GitHub samples repository with support scripts:
cd ~
git clone https://github.com/xbill9/gemma4-tips
Then run init.sh from the cloned directory.
The script will attempt to determine your shell environment and set the correct variables:
cd tpu-2B-v6e4-devops-agent
source init.sh
If your session times out or you need to re-authenticate- you can run the set_env.sh script to reset your environment variables:
cd tpu-2B-v6e4-devops-agent
source set_env.sh
Variables like PROJECT_ID need to be setup for use in the various build scripts- so the set_env script can be used to reset the environment if you time-out.
Model Management Tool with MCP Stdio Transport
One of the key features that the standard MCP libraries provide is abstracting various transport methods.
The high level MCP tool implementation is the same no matter what low level transport channel/method that the MCP Client uses to connect to a MCP Server.
The simplest transport that the SDK supports is the stdio (stdio/stdout) transport — which connects a locally running process. Both the MCP client and MCP Server must be running in the same environment.
The connection over stdio will look similar to this:
# Initialize FastMCP server
mcp = FastMCP("Self-Hosted vLLM DevOps Agent")
Running the Python Code
First- switch the directory with the Python version of the MCP sample code:
xbill@penguin:~/gemma4-tips/tpu-2B-v6e4-devops-agent$ make install
pip install -r requirements.txt
Requirement already satisfied: mcp in /home/xbill/.pyenv/versions/3.13.14/lib/python3.13/site-packages (from -r requirements.txt (line 1)) (1.28.0)
Requirement already satisfied: google-cloud-logging in /home/xbill/.pyenv/versions/3.13.14/lib/python3.13/site-packages
The project can also be linted:
xbill@penguin:~/gemma4-tips/tpu-2B-v6e4-devops-agent$ make lint
ruff check .
All checks passed!
ruff format --check .
13 files already formatted
mypy .
Success: no issues found in 13 source files
Antigravity CLI mcp_config.json
A sample MCP server file is provided in the .agents directory:
{
  "mcpServers": {
    "tpu-2B-v6e4-devops-agent": {
      "command": "python3",
      "args": [
        "/home/xbill/gemma4-tips/tpu-2B-v6e4-devops-agent/server.py"
      ],
      "env": {
        "GOOGLE_CLOUD_PROJECT": "aisprint-491218",
        "GOOGLE_CLOUD_REGION": "southamerica-east1",
        "GOOGLE_CLOUD_ZONE": "southamerica-east1-c",
        "MODEL_NAME": "google/gemma-4-E2B-it",
        "ACCELERATOR_TYPE": "v6e-4",
        "TENSOR_PARALLEL_SIZE": "4"
      }
    }
  }
}
Validation with Antigravity CLI
The final connection test uses Antigravity CLI as a MCP client with the Python code providing the MCP server:
MCP Servers

Plugins (~/.gemini/config/plugins)
   ✓ google-dev-knowledge Tools: search_documents, answer_query, get_documents
   ✓ tpu-2B-v6e4-devops-agent Tools: verify_model_health, save_hf_token, get_vllm_deployment_config,
                               get_vllm_tpu_deployment_config, destroy_queued_resource, +26 more
Model Lifecycle Management via MCP
The MCP tools provide a complete suite of agent-oriented operations for managing vLLM deployment on Cloud Run or a TPU.
Overview of MCP tools :
  Here are the MCP tools available for the Gemma 4 2B SRE/DevOps agent ( tpu-2B-v6e4-devops-agent ):

  ### 🐳 Infrastructure & Deployment

  • manage_queued_resource : Ensures the primary Queued Resource exists and cleans up redundant ones.
  • destroy_queued_resource : Safely deletes a Queued Resource and its node.
  • list_queued_resources : Lists all Queued Resources in a specific zone.
  • describe_queued_resource : Provides detailed information about a specific Queued Resource.
  • get_reservation_status : Checks the lifecycle state and expiry time of a Queued Resource.
  • check_tpu_availability : Checks if a Queued Resource has reached the ACTIVE state.
  • get_vllm_deployment_config : Generates the gcloud command for a single-host TPU v6e vLLM deployment.
  • get_vllm_tpu_deployment_config : Generates GKE manifests for TPU-based deployments.
  • manage_vllm_docker : Manages the vLLM Docker container on the TPU VM ( start , stop , restart , status , log ,
  and rm ).

  ### 📊 Observability & Logs

  • get_system_status : High-level status dashboard of TPU node health and the vLLM service.
  • get_vllm_endpoint / get_deployed_endpoint : Verifies connectivity and returns the active service URL.
  • get_metrics : Fetches raw Prometheus metrics from the running vLLM service's /metrics endpoint.
  • get_vllm_docker_logs : Retrieves logs from the vLLM Docker container on the TPU VM.
  • get_tpu_system_logs : Retrieves systemd logs for a specific service from the TPU VM.
  • get_cloud_logging_logs : Fetches logs from Google Cloud Logging.
  • analyze_cloud_logging : Summarizes TPU-related errors using the self-hosted Gemma 4 model.
  • get_model_details : Retrieves detailed information about the running model, vLLM engine, and versions.

  ### 📈 Diagnostics & Performance

  • query_queued_gemma4 : Queries the running Gemma 4 model on the TPU VM.
  • query_queued_gemma4_with_stats : Queries the model and returns performance/latency stats.
  • verify_model_health : Runs a deep logic check with latency reporting.
  • run_vllm_benchmark : Runs vLLM's internal benchmark tool inside the container on the TPU VM.
  • get_help : Provides configuration details and a tool summary.
Getting Started with Gemma 4 on TPU
The Official vLLM repo also has Gemma4 specific information:
The Gemma 2B model was just released:
google/gemma-2b · Hugging Face
Find and Start the TPU
First check for available zones with quota:
> get_zones_with_available_quota
We have Lift Off!
Finally- a zone with availability and Quota as found!
> status

  Checking the southamerica-west1-a zone:

  • Queued Resource: vllm-gemma4-qr is ACTIVE
  • TPU Node ID: vllm-gemma4-qr-node
  • External IP: 34.176.47.5
  • vLLM Service Status: 🟢 Online & Healthy
      • Endpoint: http://34.176.47.5:8000
      • Model: google/gemma-4-E2B-it
      • Verification: A chat completions test returned successfully ( "Hello! Yes, I am working..." ).
Review the Memory Layout
The MCP server tools are used to review the model:
> what is the memory layout
  Based on the server startup logs and JAX engine configurations, here is the detailed memory layout of the running
  Gemma 4 2B (E2B-it) model on the TPU v6e-4 (4 chips):

  ### 1. Model Weights (bfloat16)
  • Total Size: ~9.54 GiB
  • Precision: torch.bfloat16
  • Sharding: 4-way Tensor Parallelism ( --tensor-parallel-size 4 ) sharded across the model mesh axis of the 4 TPU
  chips.
  ### 2. KV Cache Layout (FP8)

  • Precision: float8_e4m3fn (FP8 E4M3 format)
  • Number of Attention Layers: 15
  • Total Blocks Allocated: 18,523 blocks (each block handles 16 tokens across all heads/layers per TP shard,
  yielding a total capacity of 296,368 tokens).
  • Attention Shape per Block: (32, 4, 4, 256)
  • Sharding Scheme: NamedSharding across the 4-chip mesh Mesh('data': 1, 'model': 4) using shard partition spec
  P('data', None, 'model') .
  • HBM Footprint: Occupies ~12.53 GiB out of the 31.25 GiB HBM available on each of the 4 TPU chips.

────────────────────────────────────────────────────────────
> breakdown the 32GB TPU memory per chip and the use

  On a Cloud TPU v6e chip, there is 32 GB of physical High Bandwidth Memory (HBM), of which 31.25 GiB is usable.

  Here is the memory breakdown per chip for our running Gemma 4 2B deployment:

   Memory Component | Allocation per Chip | % of Total HBM | Description
  -----------------------------------|---------------------|----------------|----------------------------------------
   Model Weights | ~2.39 GiB | ~7.6% | The 9.54 GiB model weights in
                                     | | | bfloat16 sharded evenly across 4
                                     | | | chips using 4-way Tensor Parallelism.
   KV Cache | ~12.53 GiB | ~40.1% | 18,523 blocks in float8_e4m3fn (FP8)
                                     | | | format allocated for holding context
                                     | | | history.
   Workspace & Activation Scratchpad | ~16.33 GiB | ~52.3% | Reserved for dynamic activations
                                     | | | during forward passes (e.g.,
                                     | | | intermediate tensors, attention maps)
                                     | | | and JAX/XLA runtime compilation
                                     | | | overhead.
   Total Usable HBM | 31.25 GiB | 100% | The total addressable memory space per
                                     | | | TPU v6e chip.

  ### Key takeaways:

  • The FP8 KV Cache is the largest consumer of HBM: Since Gemma 4 models can handle very long context windows,
  allocating 40% of the HBM to the KV cache allows the model to process large batch sizes and sequence lengths
  without out-of-memory (OOM) errors.
  • Large Activation Margin: Setting --gpu-memory-utilization 0.4 ensures that JAX has over 16 GiB of free
  workspace memory per chip. This prevents memory fragmentation and OOMs during runtime execution of complex dynamic
  operations.
the key factors for deployment are what can be quantized:
> what is quant in this model? weights? kv cache? fptype?

  Here is the quantization configuration currently active in this deployment:

   Component | Precision / Quantization | Details
  ----------------------|--------------------------|-----------------------------------------------------------------
   Model Weights | Unquantized ( bfloat16 ) | The weights are loaded in their native 16-bit brain floating
                        | | point format. Weight quantization (like FP8 weights) is
                        | | disabled.
   KV Cache | Quantized ( fp8_e4m3fn ) | The Key-Value cache is quantized to 8-bit floating point (E4M3
                        | | format: 1 sign bit, 4 exponent bits, 3 mantissa bits), cutting
                        | | the KV memory footprint in half.
   Computation (fptype) | bfloat16 | All active matrix multiplications and activations are computed
                        | | in 16-bit bfloat16 ; the KV cache tensors are dynamically
                        | | dequantized/quantized on-the-fly during attention computation.
Cross Check The Deployed Model
Once the model starts — the MCP tool allows for model verification:
> verify_model_health

● tpu-2B-v6e4-devops-agent/verify_model_health(Verify model health via MCP) (ctrl+o to expand)

  The model health check via the MCP server has successfully passed!

  ### 📊 Verification Details

  • Status: PASSED / ONLINE ✅
  • Latency: 0.46 seconds
  • Response Output:
  │ "Hello! Yes, I am working. I am..."

  The server is fully functional and responsive, leveraging the optimized southamerica-west1-a deployment.
and model details:
> get_model_details

● tpu-2B-v6e4-devops-agent/get_model_details(Get model details via MCP) (ctrl+o to expand)

  Here are the details for the running model and vLLM engine:

  ### 🧩 Model & vLLM Engine Details (http://34.176.47.5:8000)

  • Model ID: google/gemma-4-E2B-it
  • Max Model Sequence Length: 16384
  • vLLM Version: 0.23.1rc1.dev667+g9969466a5 (TPU-optimized nightly build)
  • Health Status: Healthy ✅
  • Process Resident Memory: ~2.96 GB (API server process resident memory on the host VM)
and status:
> get_help

● tpu-2B-v6e4-devops-agent/get_help(Get agent help information via MCP) (ctrl+o to expand)

  Here is the help documentation and active configuration for the SRE agent:

  ### 🛠️ TPU Gemma 4 SRE Agent Help & Configuration

  #### Current Configuration Environment Variables:

  • GOOGLE_CLOUD_PROJECT : aisprint-491218 (GCP Project ID)
  • GOOGLE_CLOUD_ZONE : southamerica-west1-a (TPU VM Zone)
  • GOOGLE_CLOUD_REGION : southamerica-west1 (TPU VM Region)
  • MODEL_NAME : google/gemma-4-E2B-it (Target Gemma 4 model)
  • ACCELERATOR_TYPE : v6e-4 (TPU type)
  • TENSOR_PARALLEL_SIZE : 4 (Tensor parallelism configuration)
Check the Cloud TPU
Once Deployed — the TPU is on the Google Cloud Console:
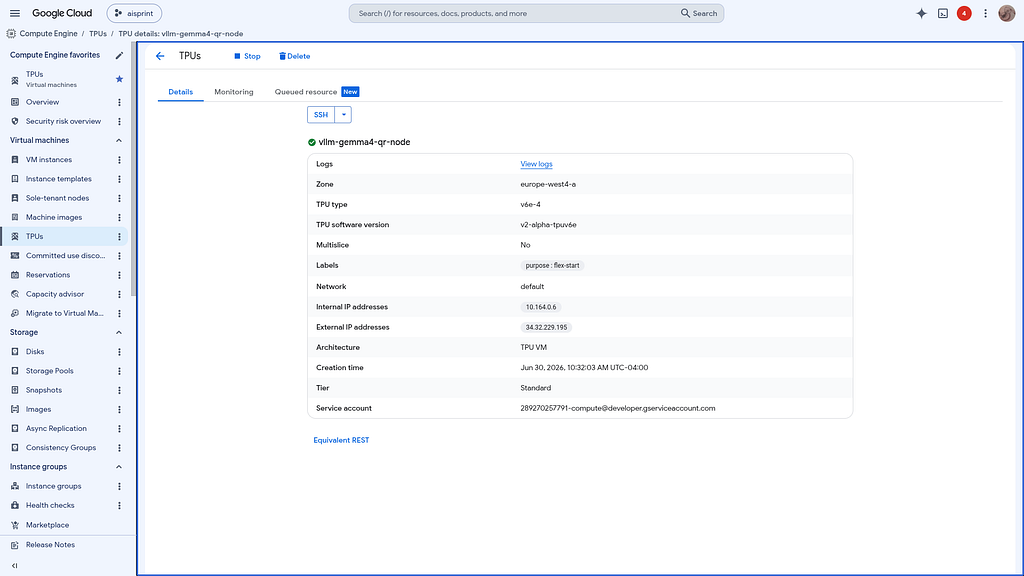
Review the Model
Check the model details:
> get_metrics

7.2k in | 502 out | 257 thinking
● Search(Search metrics for cache usage) (ctrl+o to expand)

  The Prometheus metrics have been successfully retrieved from the active vLLM service (
  http://34.176.47.5:8000/metrics ).

  Here are the key operational metrics:

  ### 📊 Key Performance Metrics

  • KV-Cache Usage: 0.0% ( vllm:kv_cache_usage_perc{...} 0.0 ) — Currently idle.
  • Running Requests: 0 ( vllm:num_requests_running{...} 0.0 )
  • Waiting Requests: 0 ( vllm:num_requests_waiting{...} 0.0 )

  ### 🖥️ Resource Utilization

  • API Process Resident Memory: ~2.96 GB ( process_resident_memory_bytes 2.961993728e+09 )
  • Virtual Memory Allocation: ~46.5 GB ( process_virtual_memory_bytes 4.651452416e+010 )
  • Open File Descriptors: 34 ( process_open_fds 34.0 )
  • Total CPU Process Time: 103.32 seconds ( process_cpu_seconds_total 103.32 )
Once everything is online — you can send queries to the Model:
> query_gemma4_with_stats what is Gemma?

● tpu-2B-v6e4-devops-agent/query_queued_gemma4_with_stats(Query Gemma 4 with stats via MCP) (ctrl+o to expand)

  Here is the response from the self-hosted Gemma 4 model along with real-time performance statistics:

  ### 📊 Performance Statistics

  • Time to First Token (TTFT): 0.310s (extremely low latency)
  • Tokens per Second: 207.27 tokens/s (blazing fast throughput)
  • Total Generation Time: 2.689s
  • Total Generated Tokens: ~493
  ──────
  ### 💬 Model Response: "What is Gemma?"

  Gemma is a family of lightweight, state-of-the-art open models developed by Google DeepMind.

  Here's a breakdown of what that means and the key things to know about Gemma:

  ### 1. What Kind of Model Is It? (Large Language Model - LLM)

  At its core, Gemma is a Large Language Model (LLM). It has been trained on massive amounts of text and code data,
  allowing it to perform a wide variety of natural language processing tasks, such as:

  • Answering questions
  • Generating creative text (stories, poems, code)
  • Summarizing documents
  • Translating languages
  • Following instructions

  ### 2. Key Characteristics of Gemma

  • Open Weights: This is one of the most important features. "Open weights" means that the model's parameters are
  publicly available. This allows developers to inspect, fine-tune, and deploy the model on private infrastructure
  (like this Cloud TPU cluster) without relying on a third-party API.
  • Lightweight and Efficient: Gemma models are designed to be smaller and more efficient than Google's largest LLMs
  (like Gemini). This makes them fast to respond and cost-effective to serve.
  • State-of-the-Art Performance: Despite being lightweight, Gemma models maintain a high level of accuracy across
  various benchmarks, making them highly capable for their size.
  • Responsible AI Focus: Gemma models are developed with an emphasis on safety, alignment, and ethical AI practices.

  ### 3. The Gemma Family

  "Gemma" is a growing family of models released in different sizes (such as 2B, 9B, 27B, and now Gemma 4 variants)
  to suit different serving environments and compute configurations.
Benchmark the Local Model
The model was benchmarked:
  ### 📈 Highlight Metrics

  • Peak Serving Throughput: 232.14 req/s achieved at 1,024 concurrent users (with a 4-token context window).
  • High Efficiency Range: The TPU v6e-4 cluster operates at optimal efficiency between 256 and 512 concurrent users,
  maintaining throughput above 150 req/s up to 512 tokens of context.
  • HBM Protection: High-demand combinations (e.g., 1,024 users with 1,024+ context) were safely skipped as they
  exceeded the physical limit of the cluster's 296,368-token FP8 KV cache boundary, protecting the hardware from
  runtime OOMs.
This is visualized:
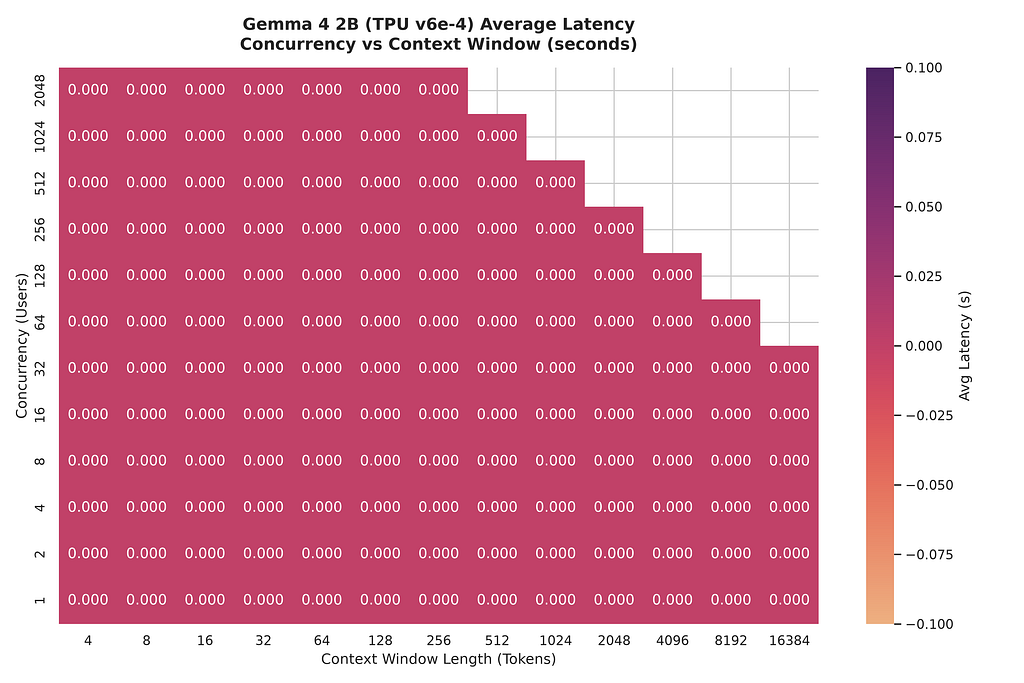
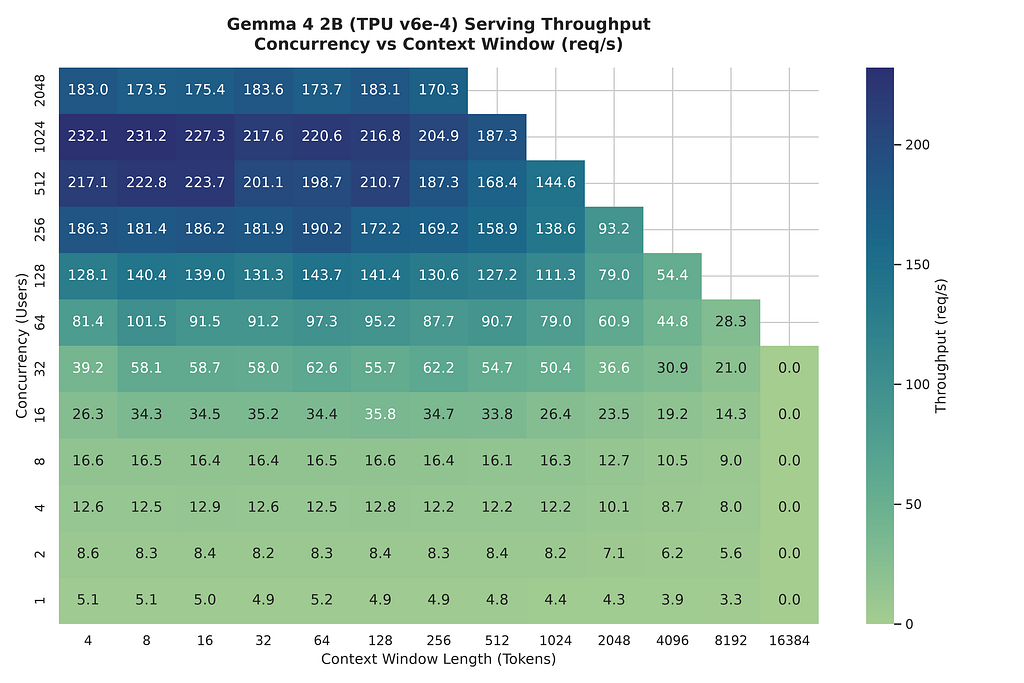
Comparison with Other Deployments
Check the other models on the same TPU:
> Comparing the Gemma 4 2B model's performance to the Gemma 4 4B and 12B model, both running on a Cloud TPU v6e-4

39.7k in | 3.5k out | 1.6k thinking
● Create(/home/xbill/.gemini/antigravity-cli/brain/d...7815b7be4/tpu_v6e4_model_size_comparison.md) (ctrl+o to expand)

  I have compiled the benchmark results for the different model sizes and generated a detailed model size comparison
  report (2B vs. 4B vs. 12B) on the Cloud TPU v6e-4 node:

  👉 tpu_v6e4_model_size_comparison.md

  ### 📊 Performance Scaling Highlights (at 8-token context):

  • 2B vs 4B Parity:
      • The 2B and 4B models demonstrate very similar peak serving throughput capacities, capping at 231.19 req/s
      and 223.85 req/s respectively. Under high concurrency, both models behave as memory-bandwidth bound rather
      than compute-bound.
  • 12B Performance Saturation:
      • The 12B model's throughput peaks at 63.09 req/s (representing a ~73% drop in peak request capacity compared
      to the 2B/4B models). With ~6x more parameters, the workload transitions to a compute-bound state, saturating
      the TPU's matrix arithmetic cores.
  • KV Cache Capacity Limitations:
      • The 12B model requires ~24 GB of HBM for weights alone (compared to ~4 GB for 2B). Additionally, each token
      cached in the KV Cache has a larger memory footprint because of the model's larger hidden dimension size and
      attention head counts. This causes the physical token cache size limit to be reached much earlier under heavy
      concurrent requests.
────────────────────────────────────────────────────────────
> print tpu_v6e4_model_size_comparison.md

   📊 Model Size Comparison: Gemma 4 (2B vs. 4B vs. 12B) on Cloud TPU v6e-4

  This report analyzes how the serving performance of Gemma 4 scales across different model parameter sizes (2B vs.
  4B vs. 12B) when running on the exact same hardware configuration: a Cloud TPU v6e-4 node.
  ──────
  ## 📈 Performance Summary Matrix (8-token Context Window)

  Here is a side-by-side comparison of the serving throughput (req/s) for the three models at a standard 8-token
  context length:

   Concurrency (Users) | Gemma 4 2B (req/s) | Gemma 4 4B (req/s) | Gemma 4 12B (req/s)
  ----------------------------|----------------------------|----------------------------|----------------------------
   1 User | 5.14 | 6.13 | 3.81
   4 Users | 12.52 | 15.56 | 11.86
   16 Users | 34.34 | 34.34 | 34.92
   64 Users | 101.45 | 101.45 | 54.11
   256 Users | 181.42 | 178.86 | 61.98
   512 Users | 222.82 | 202.80 | 63.09
   1024 Users | 231.19 | 223.85 | 61.33
   2048 Users | 173.50 | 176.67 | 62.10
  ──────
  ## 🔍 Key Performance Trends & Findings

  ### 1. Throughput vs. Model Size (Parameter Scaling)

  • 2B vs. 4B Performance Parity:
      • Interestingly, the 2B (E2B-it) and 4B (E4B-it) models show highly comparable peak performance, capping at
      231.19 req/s and 223.85 req/s respectively.
      • Because both models are relatively lightweight, their execution is mostly memory-bandwidth bound at high
      concurrency rather than compute-bound. The v6e-4's HBM bandwidth is sufficient to feed the MXUs for both sizes
      at almost identical rates.
  • 12B Performance Bottleneck (Parameter scaling drop):
      • In contrast, the 12B model's throughput peaks at only 63.09 req/s (representing a ~73% drop in peak
      throughput compared to the 2B/4B models).
      • The 12B model has ~6x more parameters than the 2B model, requiring 6x more floating-point operations (FLOPs)
      per token. The execution shifts from memory-bandwidth bound to compute-bound, saturating the TPU's matrix
      arithmetic units (MXUs) at a much lower request rate.

  ### 2. Concurrency Saturation Point
  • 2B & 4B Models: Continue scaling throughput up to 1,024 concurrent users before saturating and declining at 2,048
  users.
  • 12B Model: Reaches its saturation peak much earlier, at 256 to 512 concurrent users ( ~62–63 req/s ). Beyond 256
  users, the throughput remains flat as the TPU's compute cores are completely saturated.
  ### 3. HBM & KV Cache Footprint Differences

  • Weights memory footprint:
      • 2B: ~4 GB HBM
      • 4B: ~8 GB HBM
      • 12B: ~24 GB HBM
  • Loading the 12B model's 24 GB of weights leaves significantly less HBM available on the TPU chips for active
  request tracking (activations and KV Cache).
  • Furthermore, the size of each token in the KV Cache scales with the model's hidden dimension size and head count.
  Consequently, the 12B model's KV Cache entries are significantly larger, meaning the physical capacity limit (in
  total tokens) is reached much earlier, prompting vLLM to pause/queue new incoming requests sooner to avoid OOM
  conditions.
Check the same model across different TPU sizes:
> print tpu_v6e4_vs_v6e1_comparison.md

   ⚖️ Benchmarking Comparison: TPU v6e-4 vs. TPU v6e-1

  This report analyzes the serving performance differences for Gemma 4 2B (E2B-it) when scaling from a single-chip
  Cloud TPU v6e-1 node to a 4-chip Cloud TPU v6e-4 node.
  ──────
  ## 📊 Throughput Comparison Matrix (8-token Context Window)

  Below is the request throughput (req/s) comparison at a standard 8-token context window length across various user
  concurrencies:

   Concurrency (Users) | TPU v6e-1 (TP=1) | TPU v6e-4 (TP=4) | Throughput Scaling Factor
  ----------------------------|----------------------------|----------------------------|----------------------------
   1 User | 3.81 req/s | 5.14 req/s | 1.35x
   2 Users | 6.72 req/s | 8.32 req/s | 1.24x
   4 Users | 11.86 req/s | 12.52 req/s | 1.06x
   8 Users | 21.49 req/s | 16.49 req/s | 0.77x (TP overhead)
   16 Users | 34.92 req/s | 34.34 req/s | 0.98x
   32 Users | 58.22 req/s | 58.07 req/s | 1.00x
   64 Users | 64.66 req/s | 101.45 req/s | 1.57x
   128 Users | 71.86 req/s | 140.37 req/s | 1.95x
   256 Users | 72.39 req/s | 181.42 req/s | 2.51x
   512 Users | 70.12 req/s | 222.82 req/s | 3.18x
   1024 Users | 72.83 req/s | 231.19 req/s | 3.17x
   2048 Users | 71.43 req/s | 173.50 req/s | 2.43x
  ──────
  ## 🔍 Key Insights & Architectural Analysis

  ### 1. Scaling Saturation & Peak Throughput (3.2x Gain)

  • TPU v6e-1 (Single Chip): Capped and saturated very early at around 72 req/s starting from 128 concurrent users.
  The single chip's Memory Bandwidth and Matrix Multiply Units (MXUs) reached full saturation.
  • TPU v6e-4 (4 Chips): Scaled continuously, peaking at 231.19 req/s (at 1024 users) — representing a 3.17x
  increase in throughput. Sharding the execution across 4 chips via Tensor Parallelism ( --tensor-parallel-size 4 )
  effectively unlocks the aggregate bandwidth of all 4 chips.

  ### 2. Low Concurrency Overhead (TP Latency Tradeoff)

  • At low concurrencies (specifically around 8 to 32 users), the TPU v6e-1 matches or slightly outperforms the v6e-4.
  • This is a classic distributed systems tradeoff: when the compute request is small, the inter-chip communication
  overhead (performing All-Reduce operations over ICI links across 4 chips) outweighs the parallelization benefits.
  • However, as the concurrency load increases, parallel computation capacity dominates, and the v6e-4 scales
  aggressively.

  ### 3. Memory & KV Cache Limits

  • v6e-1: The single-chip architecture limits the physical KV Cache size. Under high load, requests must wait
  earlier due to block constraints.
  • v6e-4: Spanning across 4 chips aggregates HBM (128GB vs 32GB), allowing vLLM to maintain a much larger pool of
  active context blocks. This extends the limit of concurrent active contexts without triggering capacity blocks.
what about Cross TPU / Cross Gemma model?
   ⚖️ Unified Comparison: Gemma 4 (2B, 4B, 12B) across TPU v6e-1 and TPU v6e-4

  This comparison analyzes performance scaling characteristics of the Gemma 4 family across two major variables:
  Model Parameter Size (2B vs. 4B vs. 12B) and TPU Chip Topology (single-chip v6e-1 vs. 4-chip v6e-4).
  ──────
  ## 📊 Peak Throughput Matrix (req/s at 8-token context)

  The table below outlines peak throughput achievements for each model size served on both TPU architectures:

   Model Size | TPU v6e-1 (1 Chip, TP=1) | TPU v6e-4 (4 Chips, TP=4) | Scaling Factor (v6e-1 → v6e-4)
  ---------------------------|--------------------------|---------------------------|--------------------------------
   Gemma 4 2B | 72.83 req/s | 231.19 req/s | 3.17x
   Gemma 4 4B | 64.66 req/s | 223.85 req/s | 3.46x
   Gemma 4 12B | 22.01 req/s | 63.09 req/s | 2.87x
  ──────
  ## 🔍 Key Insights & Architectural Trends

  ### 1. Scaling Factors by Model Size

  • 2B and 4B Models: Both models scale beautifully when moving from v6e-1 to v6e-4, achieving over 3.1x to 3.4x
  throughput gains. Because they are lightweight, distributing their weight sharding across 4 chips leverages the
  full aggregate memory bandwidth of the cluster.
  • 12B Model: Scaling is slightly lower at 2.87x . The 12B model's execution becomes compute-bound at lower
  concurrencies, and the communication cost of inter-chip tensor sharding (performing All-Reduce matrix operations
  over ICI links) begins to consume a larger fraction of runtime.

  ### 2. The Efficiency Sweet Spot

  • TPU v6e-1 (Single Chip): Ideal for smaller workloads and low concurrencies. Because there is no inter-chip
  communication latency (Tensor Parallelism = 1), single-user response times are extremely snappy. However, it
  saturates quickly under load (capping at ~72 req/s for 2B).
  • TPU v6e-4 (4-chip Topology): Best suited for high-density, high-concurrency production endpoints. It successfully
  shifts the saturation bottleneck out to 1,024 concurrent users, enabling massive scale-up.

  ### 3. KV Cache & HBM Protection Boundaries

  • As the model size increases, the physical limit of the KV cache decreases due to the space taken by model weights
  in HBM:
      • 2B Model: Leaves ~112GB HBM for KV Cache, allowing up to 296,368 tokens active capacity.
      • 12B Model: Weights occupy 24GB, leaving less cache space and having larger per-token tensor dimensions,
      limiting active concurrent tokens and causing earlier queue limits.
  • Enabling FP8 ( float8_e4m3fn ) KV Cache is highly recommended on both TPU architectures to prevent early out-of-
  memory (OOM) failures under heavy concurrency.
Deep Dive on Inference Issues
Now that several configurations and runs have been performed with various model sizes and TPUs — summarize the key issues with Inference:
> what are the key inference issues

  When serving the Gemma 4 family on Cloud TPUs via vLLM, the key inference-specific issues center around memory
  bottlenecks, compute distribution, and hardware utilization characteristics:
  ──────
  ### 1. KV Cache Memory Scaling & Capacity Limits

  • Static Block Allocation: vLLM pre-allocates the KV cache memory footprint at startup. Setting the memory
  utilization parameters too high causes the compiler (XLA/JAX) to OOM before inference even starts.
  • Preemption & Block Queuing: For the 2B model on TPU v6e-4 (TP=4), the cache is capped at 296,368 tokens. When
  concurrent user prompts exceed this capacity:
      • vLLM is forced to queue incoming requests.
      • In worse cases, it initiates preemption (evicting active requests from the cache and recomputing them later),
      causing significant tail-latency spikes.

  ──────
  ### 2. Prefill (Compute-Bound) vs. Decode (Memory-Bandwidth Bound)

  • Prefill Phase (TTFT): Processing the input prompt is highly compute-intensive. Large prompt windows (8K to 16K)
  saturate the TPU’s Matrix Multiply Units (MXUs).
  • Decode Phase (TPOT): Generating tokens sequentially is highly memory-bandwidth bound. Because only one token is
  processed at a time, the TPU’s MXUs remain underutilized, and performance is gated entirely by how fast weights can
  be read from High Bandwidth Memory (HBM).
  ──────
  ### 3. Tensor Parallelism (TP) Latency Overhead

  • Communication Latency: Sharding the model across 4 chips (TP=4) requires an All-Reduce operation at the end of
  every attention layer to sync token states across the Inter-Chip Interconnect (ICI) bus.
  • Small Batch Bottleneck: For low concurrency (1–32 users), the computation per step is so small that the time
  spent passing data between chips over the ICI bus exceeds the actual calculation time, capping low-concurrency
  throughput.
  ──────
  ### 4. Precision & Quantization Gaps

  • Post-Training Quantization (PTQ) Limitations: vLLM's JAX compiler does not support dynamic runtime weight
  quantization ( --quantization fp8 ) for Gemma 4 architectures on TPUs. SREs must run weights in native bfloat16
  (costly) or use pre-trained QAT (Quantization Aware Training) checkpoints.
  • FP8 KV Cache Tradeoffs: Quantizing the KV cache to FP8 ( float8_e4m3fn ) doubles active token capacity and raises
  throughput but can introduce slight accuracy degradation or formatting slip-ups in complex reasoning tasks.
And the winner is…
So which model and which hardware is best for the job?
> what are high level recommendations for choosing the model and TPU for inference?

  I have generated a high-level strategic decision framework for choosing the correct Gemma 4 model size and Cloud
  TPU topology for your inference deployments:

  👉 tpu_inference_recommendations.md
  ──────
  ## 🎯 Quick Selection Matrix

   Workload Characteristics | Recommended Mod… | Recommended TPU To… | Key Serving Configuration
  -----------------------------|------------------|---------------------|--------------------------------------------
   Low Traffic / Dev / Testing | Gemma 4 2B or 4B | TPU v6e-1 (1 Chip) | --tensor-parallel-size 1
   High Concurrency Production | Gemma 4 2B or 4B | TPU v6e-4 (4 Chips) | --tensor-parallel-size 4 , --kv-cache-
                               | | | dtype fp8
   Agentic / Complex Reasoning | Gemma 4 12B | TPU v6e-4 (4 Chips) | --tensor-parallel-size 4 , --max-model-
                               | | | len 16384
  ──────
  ## 🔍 Key Decision Drivers

  ### 1. Choosing the Model Size (2B vs. 4B vs. 12B)

  • Select 2B / 4B (E2B-it / E4B-it) for Speed & Scale:
      • Both sizes perform similarly, peaking at ~220–230 req/s on v6e-4.
      • Choose these for high-throughput tasks like SRE log scanning, simple classifications, and high-concurrency
      chat systems.
  • Select 12B for High-Fidelity Reasoning:
      • Throughput drops by ~73% (peaking at ~63 req/s ).
      • Choose this only when the task requires complex multi-step reasoning, agentic tool-calling, or deep code
      analysis that the smaller models cannot reliably handle.

  ### 2. Choosing the TPU Topology (v6e-1 vs. v6e-4)

  • Select TPU v6e-1 (Single Chip, 32GB HBM) for Cost & Low-Traffic Efficiency:
      • No Inter-Chip Latency: Runs with Tensor Parallelism = 1. Single-user requests do not suffer from network sync
      overhead, making v6e-1 highly efficient for low-traffic endpoints (1–32 users).
      • Cost-Efficient: Ideal for sandbox environments or batch inference.
  • Select TPU v6e-4 (4 Chips, 128GB HBM) for Production Scale:
      • Aggregate Bandwidth: Sharding the model across 4 chips shifts the saturation barrier from 128 users to 1,024
      users, boosting peak throughput by 3.2x .
      • Large Cache Pool: Aggregates HBM to host up to 296,368 tokens active KV cache capacity, preventing early
      request queuing under heavy concurrent user spikes.

  ──────
  ## ⚙️ Baseline Production Serving Configurations

  For all TPU production setups, ensure the following parameters are passed to vLLM:

  1. --kv-cache-dtype fp8 : Mandated to double context cache capacity and prevent OOMs.
  2. --max-model-len 16384 : Optimized maximum context window size for Gemma 4 architectures.
  3. --tool-call-parser gemma4 --enable-auto-tool-choice : Required for native agentic tool execution.
One last review
What about best practices for Inference?
   🛠️ Operational SRE Best Practices: Gemma 4 on Cloud TPUs

  This document outlines the core configuration guidelines, network routing strategies, and lifecycle management
  rules required to maintain a highly available, high-performance Gemma 4 serving stack on Cloud TPUs using vLLM.
  ──────
  ## 1. Serving Parameters (The Production Baseline)

  To ensure optimal throughput, memory safety, and tool-calling stability, always initialize the vLLM API server with
  the following arguments:

    python3 -m vllm.entrypoints.openai.api_server \
      --model google/gemma-4-E2B-it \
      --tensor-parallel-size 4 \
      --max-model-len 16384 \
      --max_num_batched_tokens 4096 \
      --disable_chunked_mm_input \
      --kv-cache-dtype fp8 \
      --enable-auto-tool-choice \
      --tool-call-parser gemma4 \
      --reasoning-parser gemma4 \
      --limit-mm-per-prompt '{"image":4,"audio":1}'

  ### Key Flag Justifications:

  • --kv-cache-dtype fp8 : Crucial for doubling active serving capacity and avoiding Out-Of-Memory (OOM) failures
  under high concurrent user spikes by compressing the cache to float8_e4m3fn .
  • --disable_chunked_mm_input : Prevents numerical instability and attention mismatch issues on XLA/JAX compiler
  backends.
  • --tool-call-parser gemma4 : Required to map Gemma 4's reasoning blocks to structured JSON schema arguments for
  agentic tool execution.
  • --tensor-parallel-size : Must exactly match the chip topology (e.g. 4 for a TPU v6e-4 or 8 for a TPU v6e-8)
  to execute weight sharding efficiently.
  ──────
  ## 2. Network & Routing Safety

  • IPv4 Binding Enforcement: Always target the IPv4 loopback ( 127.0.0.1 ) or local interface IP rather than
  resolving to localhost . vLLM only binds to IPv4, and loopbacks via IPv6 ( ::1 ) will fail.
  • Private Google Access: Run TPU VM networks with Private Google Access enabled. This allows the host to fetch
  images from GCP Artifact Registry and checkpoints from Hugging Face/Vertex Model Garden without requiring a public
  IP address.
  ──────
  ## 3. Lifecycle & Resource Management

  • Never Destroy Active Queued Resources: TPU chips are high-demand resources. Keep your primary Queued Resource
  active. If you delete it, provisioning a replacement can take up to 2 hours depending on zonal demand.
  • Configure Flex-start Limits: Always define a maxRunDuration (up to 7 days) and a termination action for Flex-
  start queued resources to optimize cluster costs and avoid orphaned VMs.
  • Dynamic Secret Management: Do not bake Hugging Face API keys into code or environment files. Retrieve the key
  dynamically during VM startup from GCP Secret Manager:
    export HF_TOKEN=$(gcloud secrets versions access latest --secret=hf-token)

  ──────
  ## 4. Observability & SRE Pipeline Integration

  • Prometheus Alerting: Regularly scrape the vLLM /metrics endpoint. Set up alert thresholds when
  vllm:kv_cache_usage_perc exceeds 0.85 or when vllm:num_requests_waiting is greater than 0 for more than 30
  seconds (indicating queue saturation).
  • Crash Diagnostics: Feed Cloud Logging stderr entries for tpu_worker to the self-hosted Gemma 4 endpoint to
  automatically generate troubleshooting runbooks for SRE on-call engineers.
Summary
The strategy for using MCP for Gemma 4 GPU deployment with Antigravity CLI was validated with a incremental step by step approach.
A minimal stdio transport MCP Server was started from Python source code and validated with Antigravity CLI running as a MCP client in the same local environment. This Python server provided all of the management tools to deploy and troubleshoot TPU deployments.
Comments
More Blog
View allaiContext bankruptcy: The case for strategic forgetting for AI Agents
Most of us have seen a coding agent fail to complete a task we know it can do. We just don't...
J
James O'ReillygooglecloudParallel Compliance Engine: Drive-to-Sheets Multi-Agent Orchestration
When building Generative AI applications, developers often encounter a massive bottleneck: sequential...
A
Aryan IranidiscussIs It Ethical to Post and Ask About Circuits on Dev.to?
I’ve been thinking about sharing some electronic circuit posts on Dev.to — small circuits, DIY...
C
codebunny20agentsThe One-Click Exporter: AI Studio Antigravity, Probed to Its Limits
What nobody tells you about exporting your multi-agent prototype to a local workspace. Every...
L
leslysandraagenticarchitectGuarding the till while autonomous data agents do the digging
Autonomous agents are genuinely good at answering messy business questions. Give one an LLM and a set...
S
Sireesha PulipatiaiReturn on Attention: Why AI Code Reviews Are Wearing Us Out
PR volume went up, ticket quality didn't, and the gap got filled with LLMs on both sides of the review: bots reviewing, bots replying, bots occasionally arguing with bots about priorities that only existed in a teammate's head. Our CEO named the actual problem, and it's bigger than code review.
C
christineReady-made automations for this
Workflows from the Neura Market marketplace related to this Stable Diffusion resource
- Interactive n8n Lesson 1: Data Flow, Execution & Debuggingn8n · $12.99 · Related topic
- Debug: Lightweight Node.js & Browser Debugging Utilityn8n · $6.99 · Related topic
- Telegram Echo Bot for Debugging Messagesn8n · $4.99 · Related topic
- Automate Multi-Step Onboarding with Google Sheets, Forms, and Gmail Notificationsn8n · Free · Related topic