
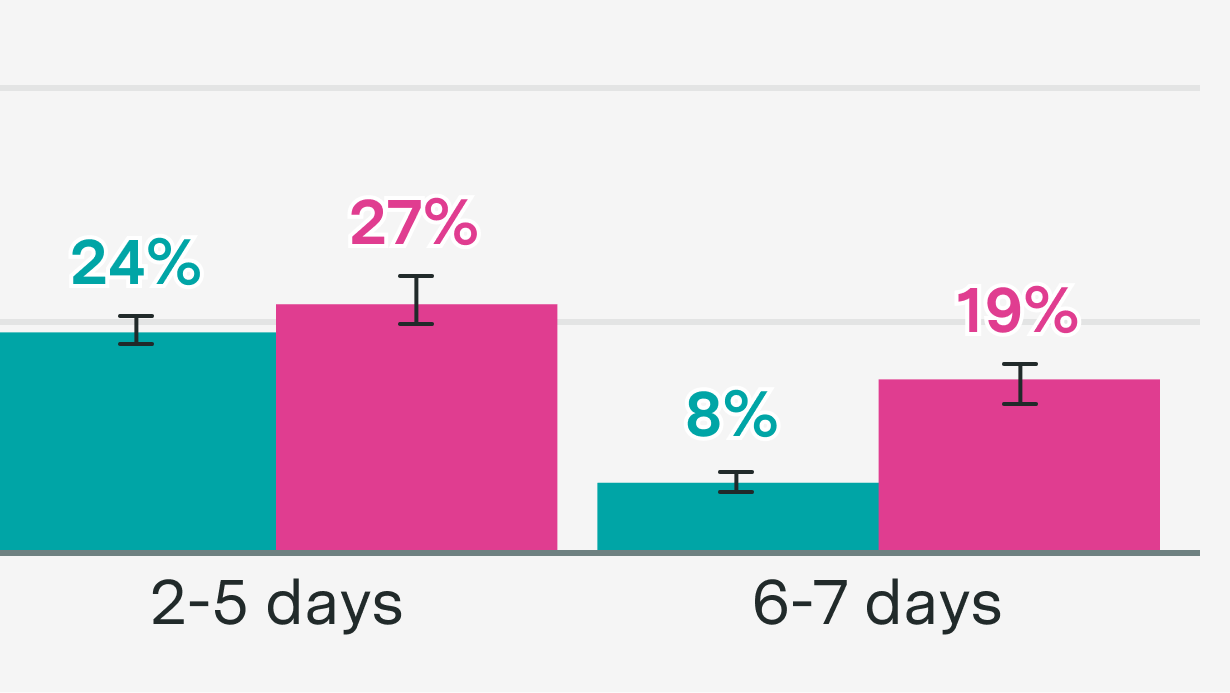
The share of US adults who use artificial intelligence at least six days a week rose from 8% in March 2026 to 19% in August 2026, according to two Epoch AI/Ipsos surveys published as a data insight on Sep. 14, 2026. The finding means near-daily AI use among American adults more than doubled in six months.
The same pair of surveys shows the opposite movement at the low end of the frequency scale. The share of US adults using AI just one day in the previous week fell from 17% in March 2026 to 10% in August 2026. Together, the two shifts point to a population moving from occasional contact with AI services toward routine, near-daily use, though the authors caution that the two waves are not directly comparable.
What the Two Surveys Asked
Epoch AI, a research organization that publishes AI trends, statistics, and benchmarking data, fielded both surveys with Ipsos, the market research and polling company, recruiting respondents through Ipsos' KnowledgePanel, a probability-based online panel. Respondents were recruited at random, and estimates were weighted to be representative of US adults.
The March survey was fielded March 3-5, 2026, with n=2,017. The August survey was fielded August 28-30, 2026, with n=1,016. Both samples covered US adults aged 18 and over. Respondents who failed an attention check were removed, and the reported sample sizes reflect that removal.
The two questionnaires differed in how they measured weekly use. In March, respondents were asked which AI services they had used in the past week. Those who reported at least one service were then asked a single overall question about how many days they had used an AI service, with response options of "Once (1 day)," "2-5 days," and "Nearly every day (6-7 days)."
In August, respondents were asked which AI services they had used in the past 7 days. For each service they selected, they were asked on how many of those 7 days they had used it, with response options running from 1 to 7. The August day counts were then collapsed into the same three groups used in March.
For each survey wave, the authors computed the share of respondents who had used an AI service in the past week and grouped them by days of use: 1 day, 2-5 days, and 6-7 days. Within each wave, the three groups and non-users sum to 100%, and all shares are percentages of all US adults, not of AI users.
A weekly AI user was defined as someone selecting at least one AI service on the past-week use question. Respondents who skipped that question were counted as non-users. For March, days of use were taken directly from the three response options. For August, the maximum number of days across a respondent's selected services was taken and grouped into the same three buckets. A small number of AI users did not answer the days question: 4 in March and 3 in August. Those cases were classified as "Days not reported" and are not shown in the graph.
Weighted shares were computed for each bucket in each survey. The authors report 90% Wilson confidence intervals for each estimate, computed on Kish's effective sample size to account for unequal weighting.
A Shift Toward Frequent Use
The headline numbers describe a clear change in the distribution of weekly AI use. In March, 8% of US adults reported using AI on 6-7 days in the previous week. By August, that figure had reached 19%. Over the same period, the one-day group shrank from 17% to 10%.
The authors describe the pattern as a shift toward more frequent AI use among US adults. Each wave drew a fresh sample rather than tracking the same individuals, so the results reflect population-level changes rather than changes within the same people.
The data insight was written by three co-authors: Amreeta Das, Caroline Falkman Olsson, and Yafah Edelman, all of Epoch AI.
Stay ahead of the AI curve
The most important updates, news, and content — delivered weekly.
No spam. Unsubscribe anytime.
Why the Comparison Comes With Caveats
The authors state plainly that comparisons of frequency across the two waves are approximate. The days-of-use question changed between waves: March asked about overall use, while August asked per service and took the maximum across services.
That difference matters in a specific direction. A respondent who used one service on 3 days and another service on 3 different days would be counted as 3 days, not 6. Because of this, the August figures may understate frequency relative to an overall-use question. The scales also differ: March offered three broad bands, while August asked for an exact count from 1 to 7. An exact count may encourage rounding to salient values such as 5 or 7, while broad bands ask only for rough placement. Being asked once per service may improve recall or inflate counts, the authors note.
The lists of AI services also differed slightly between the two waves. The March survey listed DeepSeek and Character.AI, both of which the August survey dropped. The August survey described Meta AI with examples, naming WhatsApp and Instagram. Both lists included an "Other" option, and the authors say the changes to the service lists should have little effect on the share using any AI service.
Other limitations apply to both waves. Non-respondents may differ from respondents in ways weighting does not correct for. Usage is self-reported and may be affected by recall error or misclassification.
How Epoch AI Presents the Data
The data insight includes an interactive visualization, which requires JavaScript to view. Epoch AI publishes its work free to use, distribute, and reproduce under a Creative Commons BY license, with the source and authors credited.
The two surveys sit within Epoch AI's broader polling on AI use. The organization also offers a data explorer titled "Polling on AI Usage," which tracks how employed Americans use AI at work across demographics. That explorer is one of several data explorers the organization maintains, alongside its benchmarks and publications.
What the Numbers Do and Do Not Show
The two figures at the center of the insight, 8% in March and 19% in August, describe the near-daily group as a share of all US adults. The decline from 17% to 10% describes the one-day group on the same basis. Because the three use groups and non-users sum to 100% within each wave, the movement out of the one-day bucket and into the 6-7 day bucket reflects a reallocation of the adult population rather than growth in the number of people who use AI at all.
The authors do not claim the change is larger or smaller than it appears. They note that the August approach, which takes the maximum number of days across a respondent's services, may understate frequency relative to an overall-use question. They also note that the exact-count scale in August may push responses toward round numbers such as 5 or 7. And they note that asking once per service may improve recall or inflate counts. Each of these effects could push the August estimate in a different direction, which is why the authors describe the cross-wave comparison as approximate rather than exact.
The confidence intervals reported for each estimate, at the 90% level and computed on Kish's effective sample size, reflect the weighting adjustments applied to the data. The samples themselves were drawn at random from Ipsos' KnowledgePanel, and the estimates were weighted to represent US adults aged 18 and over.
The March survey's larger sample of n=2,017 and the August survey's sample of n=1,016 both fielded over three-day windows, March 3-5 and August 28-30, 2026. The data insight that reports them was published on Sep. 14, 2026.